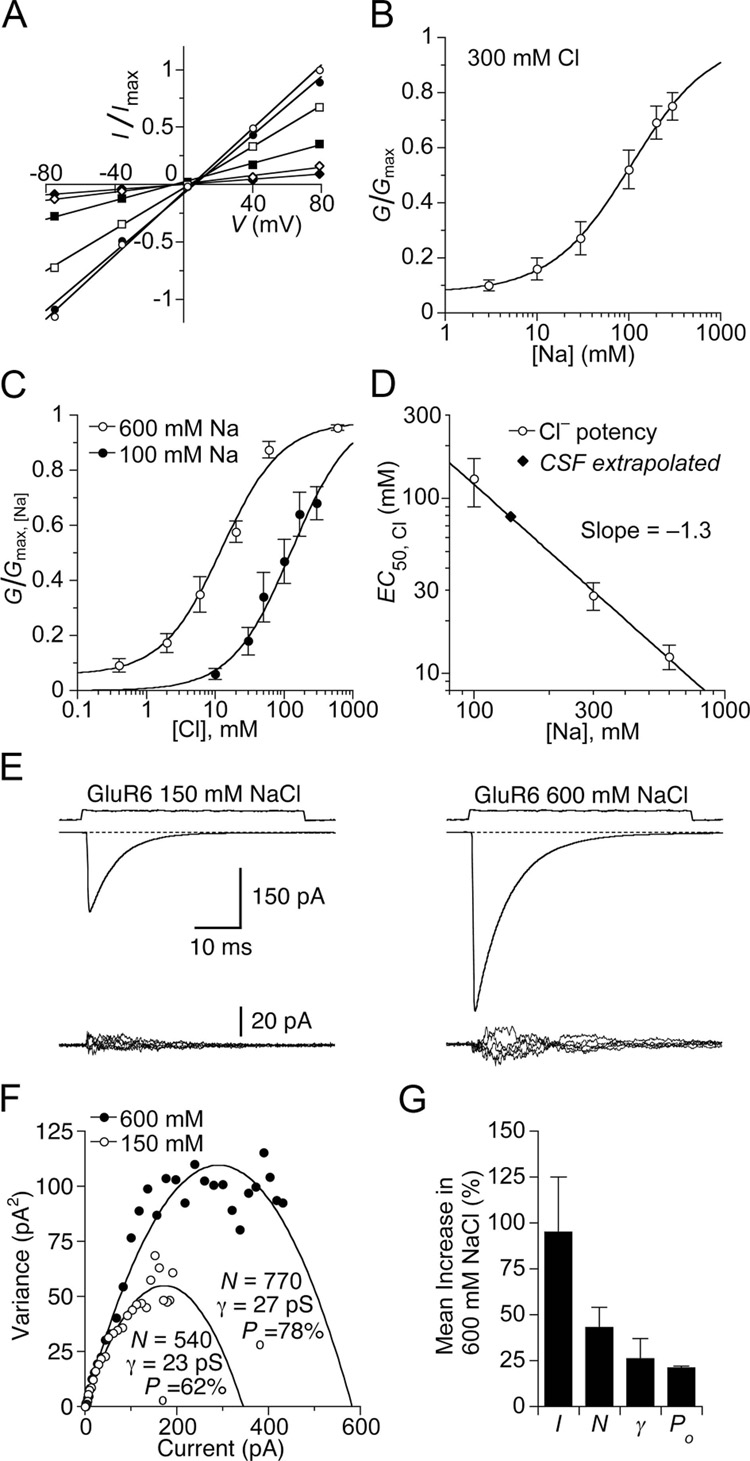
Figure 2. The Na+ and Cl− sites are allosterically coupled and not saturated in CSF.
(A) Current-voltage plot for GluR6 responses to 10 mM glutamate recorded in a range of Na+ concentrations (open circles, 300 mM; filled circles, 200 mM; open squares, 100 mM; filled squares, 30 mM; open diamonds, 10 mM; filled diamonds, 3 mM) using Cs+ as a substitute. Glutamate was titrated with CsOH. Slope conductance was fit by linear regression.
(B) Na+ concentration response curve for GluR6 fit with a single binding isotherm (EC50 = 110 ± 50 mM), with a constant to account for the residual current at low ion concentration. Data points show the mean ± SEM for six patches.
(C) Slope conductance for glutamate responses measured as in (A) but with either 100 or 600 mM Na+, with Cl− concentrations varied from 0.3 mM to 600 mM (using MeSO3− as a substitute) fit with single binding isotherms. The apparent affinity for Cl− varies with Na+ concentration: 100 mM Na+ EC50 = 130 ± 40 mM; 600 mM Na+ EC50 = 13 ± 3 mM. Data points represent the mean slope conductance ± SEM for six patches for each curve.
(D) Plot of Cl− EC50 versus Na+ concentration fit by nonlinear regression with a power relation (slope −1.3 ± 0.2). By interpolation, the EC50 for Cl− in physiological saline is about 90 mM. Data points indicate EC50 values and SDs estimated from fits shown in (C); data point at 300 mM is from Plested and Mayer, 2007.
(E) Nonstationary analysis of variance of GluR6 responses to 10 mM glutamate. Means of 60–100 traces (upper row) and 5 consecutive difference current traces (lower row) recorded in 150 and 600 mM NaCl from the same patch. The current is substantially and reversibly increased in 600 mM NaCl, when the membrane potential was adjusted to −20 mV to give the same driving force as for responses recorded in 150 mM NaCl.
(F) Current-variance plot for responses in (E). In 600 mM NaCl, the number of available receptors and open probability increases compared to 150 mM NaCl.
(G) Bar plots for the mean responses of paired observations from six patches; error bars indicate SEM. On average, the current I was increased by 100 ± 30%. The number of receptors N competent for activation by glutamate increased by 43 ± 11%; the conductance γby 26 ± 11 %; and the peak open probability by 21 ± 1%.

