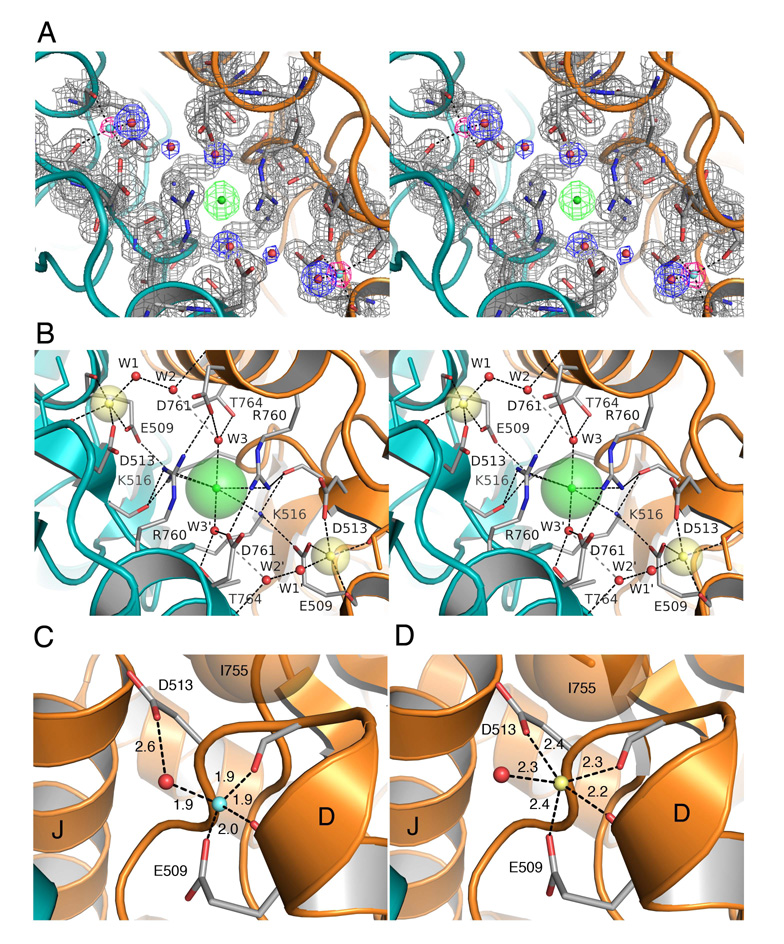
Figure 4. High resolution crystal structures of the Li+ and Na+ complexes.
(A) Stereo view of the GluR5 kainate complex with Li+ at 1.49 Å resolution. Electron density for the pair of Li+ ions is shown for an Fo-Fc omit map (pink) contoured at 3.2 σ, with Li+ omitted from the Fc calculation. Electron density for the protein (gray), water molecules (blue), and the Cl− ion (green) is shown for a 2mFo-DFc map contoured at 1.5 σ.
(B) Stereo view of the Na+ complex looking down the molecular two-fold axis of the dimer assembly onto the plane of the membrane; transparent spheres for the bound ions are drawn using Shannon radii; the Na+ and Cl− ions are linked in a network formed by the side chains of Glu509 and Lys516. Numerous salt bridges and hydrogen bonds link the subunits together.
(C) Crystal structure of the GluR5 kainate complex with Li+ in the cation binding site showing tetrahedral coordination of the ion by the side chains of Glu509, Asp 513, the main chain carbonyl oxygen of Glu509, and a H2O molecule, with bond distances in Å.
(D) Crystal structure of the GluR5 kainate complex at 1.72 Å resolution with Na+ in the cation binding site showing 5-fold coordination of the Na+ ion, and block of the 6th coordination site by the side chain of Ile755.

