
Fig. 1.
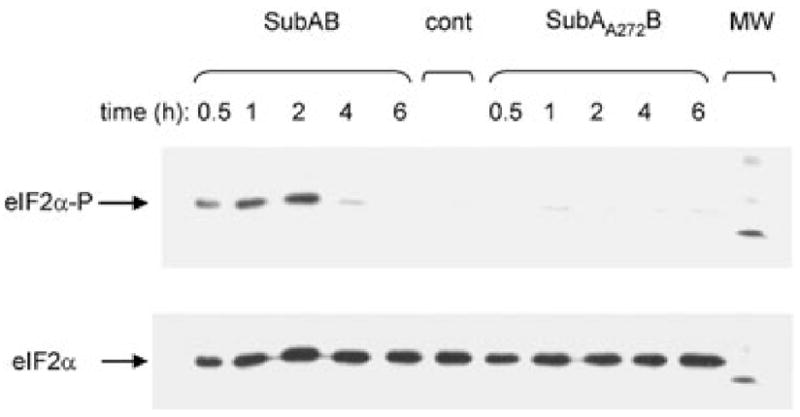
Time-course of eIF2α phosphorylation. Vero cell monolayers were treated with 1 μg ml−1 SubAB, or SubAA272B, for the indicated times. Proteins in cell extracts were separated by SDS-PAGE, electroblotted, probed with anti-phospho-eIF2α, and labelled species were detected using a HRP conjugate and ECL, as described in Experimental procedures. Filters were then stripped and re-probed using anti-eIF2α, to label total eIF2α. An untreated cell extract (cont) was also included. The visible band in the molecular marker (MW) track is 30 kDa.