
Fig. 3.
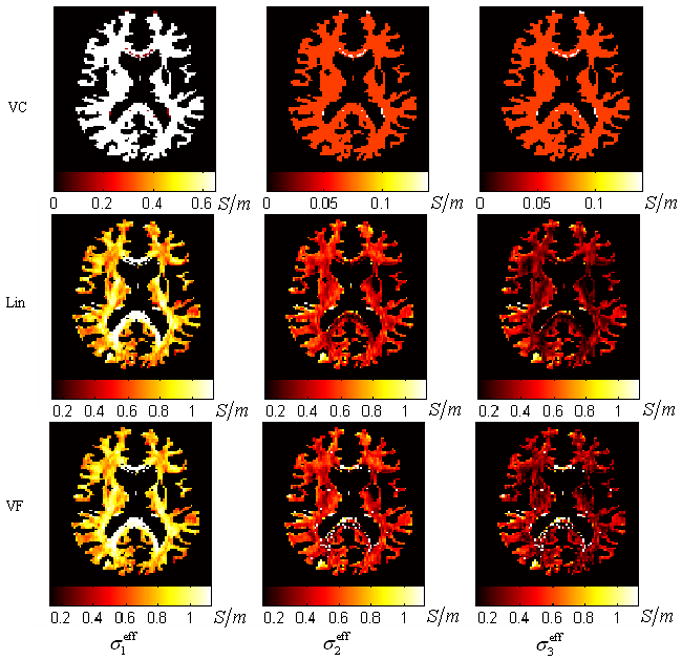
The distribution of the effective conductivity for the first group of experiment generated by the three algorithms: VC, Lin, and VF. This slice is about 66mm below the vertex. Three rows refer to the three algorithms. Three columns refer to the maps of the three sorted eigenvalues of the effective conductivity tensor.