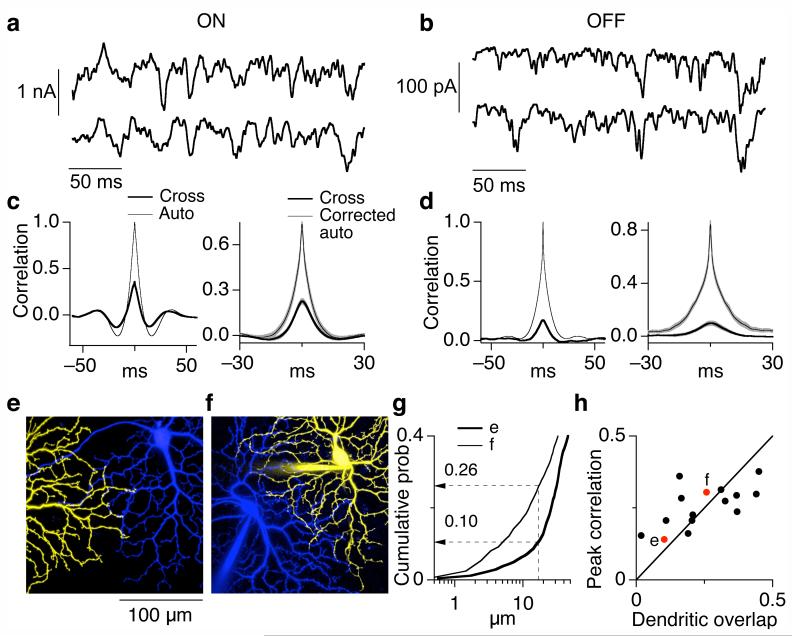
Figure 1.
Correlated variability in the synaptic inputs to neighboring ON and OFF parasol cells. (a, b) Simultaneously measured excitatory synaptic inputs to neighboring ON (a) and OFF (b) parasol cells at a holding potential of -70 mV. During recording the retina was exposed to a constant light producing ∼4,000 P*/cone/sec in M cones. (c, d) Quantification of common noise in synaptic inputs to neighboring parasol cells. The left panels compare the autocorrelation function (thin trace, average for two cells in pair) with the cross-correlation function (thick trace) for the cells in a and b. The right panels show the average cross-correlation functions and the corrected autocorrelation functions (mean ± SEM) across ON (c, n=16) and OFF (d, n=9) parasol pairs. 26 ± 2% (10 ± 2%) of the total variance was shared in ON (OFF) pairs. (e, f) Images of neighboring ON parasol cells with atypically little dendritic overlap (e) and typical dendritic overlap (f). The images shown are maximum point projections from a stack of images taken in different focal planes. (g) Cumulative distributions of nearest-neighbor dendritic distances for the cell pairs in e and f. (h) Dependence of correlation strength on dendritic overlap. Dendritic overlap was quantified from cumulative distributions as in g; locations on one cell within 17 μm of a location on the other cell were defined as overlapping.

