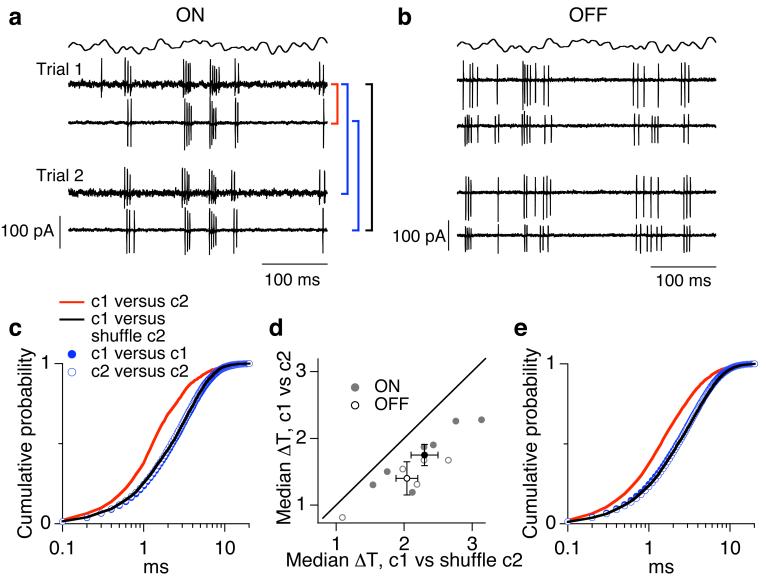
Figure 7.
Correlations affect temporal precision of ganglion cell spike responses. (a, b). Cell attached recordings of spike responses of neighboring ON (a) and OFF (b) parasol cells during modulated light stimulus. Responses to two repeats of the stimulus are shown for each cell pair. (c) Temporal precision of spike responses. Cumulative distributions of temporal offsets between spikes were calculated using the Victor distance metric to create spike pairs. Cumulative distributions are shown for responses of different cells recorded simultaneously (red) and nonsimultaneously (black) as well as for the same cell on different trials (blue and green circles). (d) Collected measurements of temporal precision for all pairs of ON (n=7) and OFF (n=5) parasol cells. (e) Temporal precision of spike responses for neighboring OFF parasol cells as in c.

