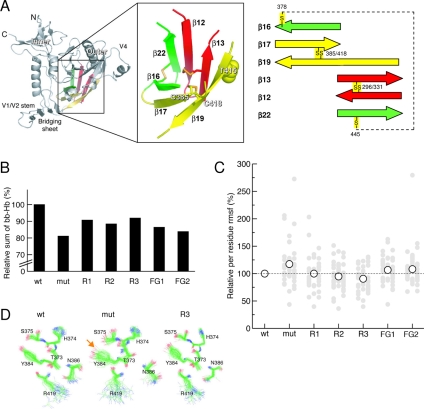
Figure 5.
Reversions change dynamics within a six-stranded β-barrel in the outer domain of HIV gp120. (A) Structure of HIV gp120 core and the β-barrel structure in the outer domain. The four-stranded bridging sheet, which joins the inner and outer domains, is indicated. The β-barrel structure in the outer domain is boxed and shown in detail on the right (see Supplemental Table 3 for definitions). The individual β-strands are labeled and colored in red, yellow, and green, corresponding to the pairs that are bridged by disulfides C296/C331, C385/C418, and C378/C445, respectively. Positions of mutations studied here (C385, C415, and T418) are labeled. The β-barrel of gp120 was defined as follows based on the structural alignment (Chen et al., 2005) (residue numbers in the structure of CD4-bound HIV-1 gp120, PDB code 1G9M, and residue numbers in unliganded SIV gp120, PDB code 2BF1 in parentheses): β12, residues 291-297 (305-311); β13, 330-334 (342-346); β16-β17, 374-387 (342-346); β19, 413-422 (426-435); and β22, 443-450 (456-463). The β-barrel structures in the unliganded SIV gp120 and the CD4-bound HIV-1 gp120 deviate marginally with a backbone Cα RMSD (44 residues, excluding the GAG linker between β12 and β13) of 0.17 nm, as calculated by ProFit (http://acrmwww.biochem.ucl.ac.uk/software/profit/). (B) Relative sums of interstrand backbone–backbone hydrogen bond occurrence among various variants τTotal (variant). The occurrence of interstrand backbone–backbone hydrogen bonds across a β-strand pair j and k of individual variants τj−k (variant) is defined as a normalized sum of the occurrence of individual interstrand backbone–backbone hydrogen bonds i within the β-strand pair j-k of the β-barrel with respect to that of wt, τj−k(variant) ≡ Σiτij−k(variant)/Σiτij−k(wt) × 100% (data not shown). The sum of all interstrand backbone–backbone hydrogen bonds within the β-barrel τTotal (variant)—those between strands 22-12, 12-13, 13-19, 19-17, and 17-16 (see Figure 5A)—is used for comparison in the text. The exact percentages relative to wt are mut, 81.1; R1, 90.7; R2, 88.4; R3, 90.9; FG1, 86.4; and FG2, 83.8. (C) Relative atomic positional RMSF of individual residues (filled gray circles) and overall average of those in the β-barrel structure (open circles). A reference line of wt (100%) is drawn (dashed line) for comparison. (D) Snapshots of selected hydrophilic residues around the mutation sites that are involved in interstrand side chain–side chain hydrogen bonding. The structures are sampled every 100 ps during the 5- to 10-ns trajectories. All structures were fit onto the backbone atoms of these residues. Oxygen, nitrogen, and carbon atoms are colored in red, blue, and green, respectively.

