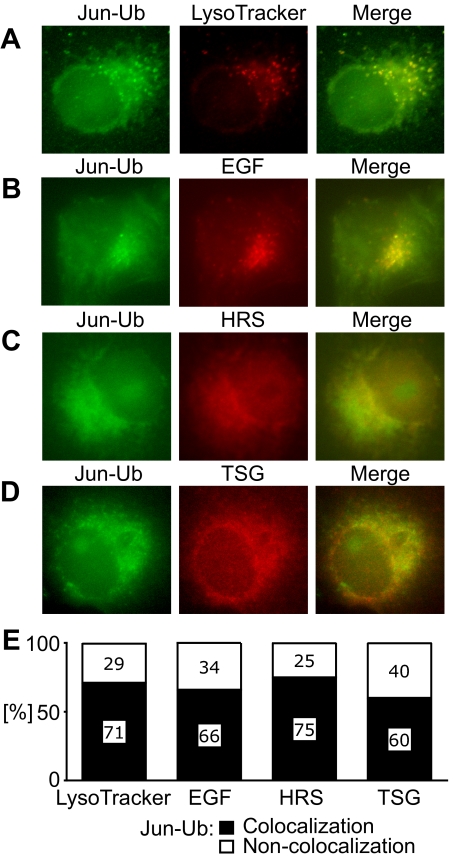
Figure 5.
Colocalization of ubiquitinated Jun with ubiquitin-binding proteins. The distribution of ubiquitinated Jun, visualized using UbFC analysis (green), was compared with LysoTracker Red (A) and EGF-rhodamine labeling (B) as well as anti-HRS (C) and anti-TSG101 (D) immunofluorescence (red). Cells that were transfected with plasmids encoding Jun and ubiquitin fused to the fluorescent protein fragments were either incubated with LysoTracker Red or EGF-rhodamine and imaged live or the cells were fixed and anti-HRS or anti-TSG101 antibodies were used to image their distributions. Images were acquired by fluorescence microscopy by using filters selective for UbFC fluorescence (left) and the respective labels (center). The images were superimposed (right). (E) Percentage of cells where more than half of the UbFC fluorescence overlapped with the fluorescence of the markers. At least 30 cells that had UbFC fluorescence intensities higher than the background signal in nontransfected cells but lower than the 10% of cells with the highest fluorescence intensities were analyzed.

