Figure 1.
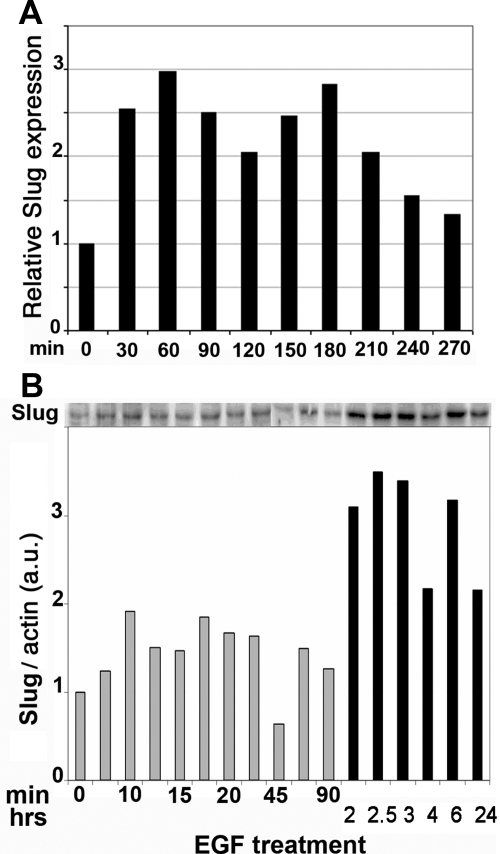
EGF induces Slug expression. Serum-starved HaCaT cells were stimulated with 10 ng/ml EGF for the indicated time before extracting RNA and protein. (A) RNA levels were measured by quantitative RT-PCR. Slug RNA levels were calculated relative to the gene 36B4, using the value 2ΔCT where ΔCT is the number of cycles between Slug and 36B4. Slug RNA levels are represented as fold induction relative to serum-starved cells. (B) Protein extracts (40 μg) were loaded on SDS-PAGE and transferred to nitrocellulose, and Slug was detected and quantified by immunoblotting, using β-actin as the reference for protein levels. Two gels were needed to span the kinetics. Protein levels were quantified from the films using NIH Image software. Abbreviation used: a.u., arbitrary unit.

