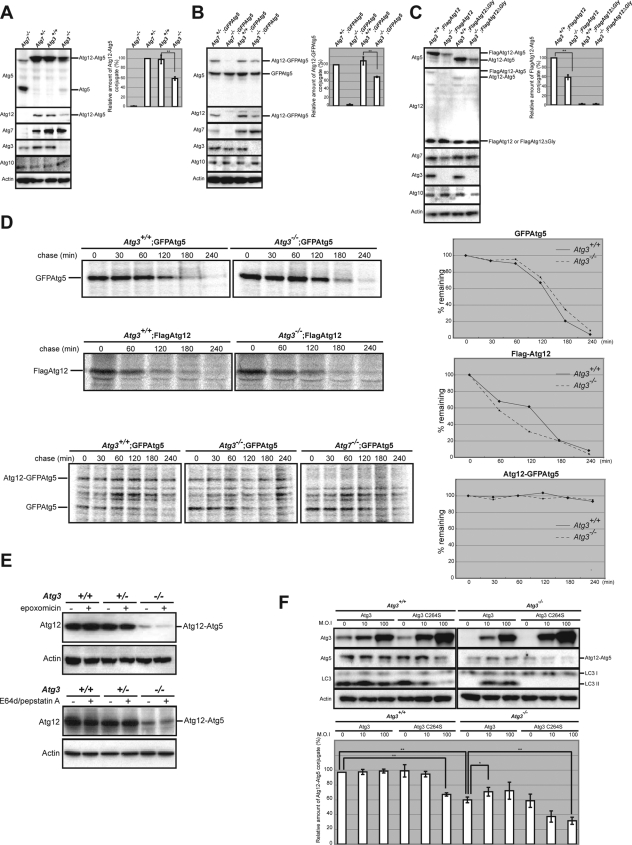
Figure 3.
Formation of Atg12–Atg5 conjugates is partially inhibited by Atg3 deficiency. (A) Immunoblot analyses of the Atg12–Atg5 conjugate. Immortalized MEFs of the indicated genotype were lysed, and the lysates were subjected to SDS-PAGE and analyzed by immunoblotting with the indicated antibodies. As a negative control for detection of Atg12–Atg5 conjugate, we used the lysate of Atg7-deficient MEFs. Note the low production of the Atg12–Atg5 conjugate in Atg3-deficient cells. (B) Each genotype immortalized MEFs with introduced GFP-tagged Atg5 were lysed, and then the lysates were subjected to SDS-PAGE followed by immunoblotting with the indicated antibodies. As a negative control for detection of Atg12–GFPAtg5 conjugate, we used the lysate of GFPAtg5-introduced Atg7-deficient MEFs. (C) Immortalized wild-type and Atg3-deficient MEFs-introduced FLAG-tagged Atg12 or Atg12ΔGly were lysed, and then the lysates were subjected to SDS-PAGE followed by immunoblotting with the indicated antibodies. As a negative control for detection of FLAGAtg12-Atg5 conjugate, we used the lysate of FLAGAtg12ΔGly-expressing MEFs. Graphs shown in A–C indicate the ratios of Atg12–Atg5, Atg12–GFPAtg5, and FLAGAtg12–Atg5 relative to actin, respectively. Data are mean ± SD of triplicate experiments. **p < 0.01 by Student's t test. (D) Half-lives of GFPAtg5, FLAGAtg12, and GFPAtg5-Atg12 conjugation in Atg3-deficient MEFs. Each immortalized wild-type and Atg3-deficient MEFs harboring GFPAtg5 or FLAGAtg12 were labeled with [35S]cysteine and methionine for 2 h and chased for the indicated time. For labeling of GFPAtg5-12 conjugate, the cells were labeled with [35S]cysteine and methionine for 24 h. Subsequently, each lysate was immunoprecipitated with anti-GFP and FLAG antibodies and then subjected to SDS-PAGE and visualized by autoradiography. As a negative control for detection of Atg12–GFPAtg5 conjugate, we used the lysate of GFPAtg5-introduced Atg7-deficient MEFs. The decay curves of GFPAtg5 (top, right), FLAGAtg12 (middle, right) and Atg12-GFPAtg5 (bottom, right) were generated from quantification of the band shown in the left panels. (E) The MEFs of the indicated genotypes were cultured in the presence or absence of a proteasome inhibitor (epoxomicin) for 16 h (top) or lysosomal inhibitors (E64d and pepstatin A: E/P) for 24 h (bottom). The cell lysates were subjected to SDS-PAGE and analyzed by immunoblotting with anti-Atg12 and anti-actin antibodies. (F) Wild-type and Atg3-deficient immortalized MEFs were infected with Atg3 and Atg3C264S at 10, or 100 multiplicity of infection (M.O.I.). After 48-h infection, the cell lysates were subjected to SDS-PAGE and analyzed by immunoblotting with the indicated antibodies. Bottom graph shows the ratios of Atg12–Atg5 relative to actin, respectively. Data are mean ± SD. **p < 0.01 by Student's t test. Data are representative of three separate experiments.

