Figure 5.
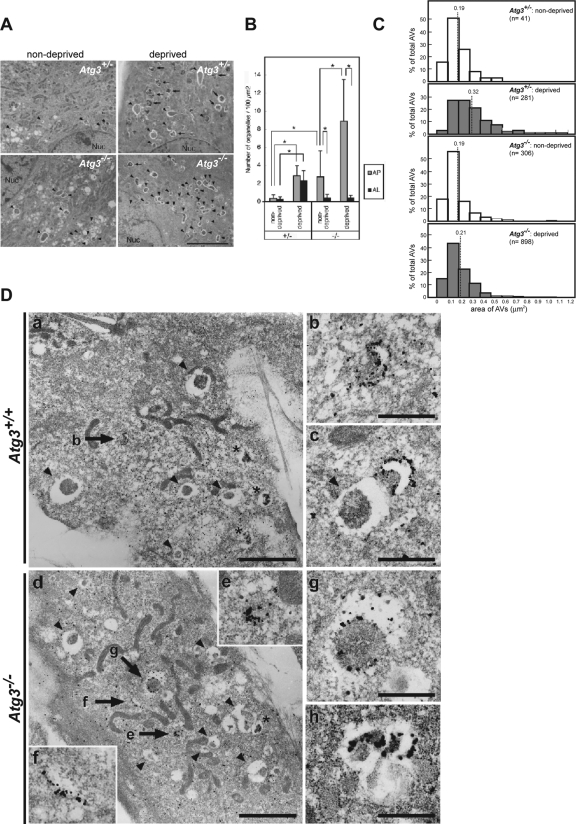
Induction of autophagosomes under starvation condition in Atg3-knockout cells. (A) Electron micrographs of primary MEFs from the indicated genotype mice under nutrient-rich (nondeprived) or -poor (deprived) condition. Bar, 5 μm. Arrowheads, autophagosomes; arrows, autolysosomes. (B) Numbers of autophagosomes (AP) and autolysosomes (AL) in each genotype were counted (n = 20; for details, see Materials and Methods). Data are mean ± SD. *p < 0.01, by Student's t test. (C) Area of autophagosome-like vacuoles (AVs) in MEFs from the indicated genotype under nutrient-rich (nondeprived) and -poor (deprived) conditions. Frequencies (percentages) of the given range of area are expressed in the histogram. The dotted line represents the mean value of the area in each genotype. (D) Immunoelectron micrograph showing labeling of GFP (a and b) and Atg16L (c–h) in wild-type (a–c) and Atg3-deficient MEFs (d–h) harboring GFPAtg5 under nutrient deprivation conditions. b is a higher magnification view of the GFPAtg5-positive structure indicated by the arrow in a. Higher magnification views of the Atg16L-positive structures indicated by arrows in d are shown in insets e and f. Arrowheads indicate autophagosome-like structures without GFPAtg5 or Atg16L signal. Asterisks indicate autolysosomes. Bars, 0.5 μm.

