Figure 8.
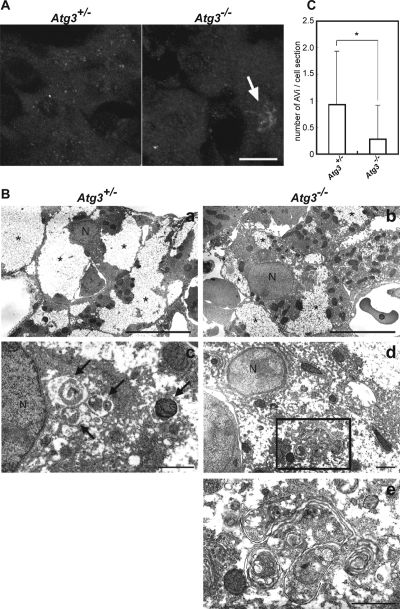
Suppression of formation of early isolation membranes and appearance of aberrant membranous structures in Atg3-deficient hepatocytes. (A) Immunofluorescence analysis of Atg16L in hepatocytes from Atg3+/− (left) and Atg3−/− (right) newborn mice. Each newborn mouse was fixed at 6 h after Cesarean delivery. Atg16L-positive structures were observed in Atg3+/−, but only few in Atg3−/− neonate hepatocytes. Arrow indicates a pleomorphic structure positive for Atg16L. Bar, 10 μm. (B) Electron microscopic analysis of hepatocytes from Atg3+/− (a and c) and Atg3−/− (b, d, and e) newborn mice. Each newborn mouse was fixed for electron microscopy at 6 h after Cesarean delivery. Typical autophagosomes (arrows) were observed in Atg3+/−, but fewer in Atg3−/− neonatal hepatocytes. Aberrant membranous structures occurred in Atg3−/− neonate hepatocytes (d and e). e is a magnification view of the boxed region in d. Note that the glycogen area (asterisks) is smaller in mutant hepatocytes than heterozygous hepatocytes. N, nucleus. Bars, 10 μm (a and b) and 1 μm (c–e). (C) The number of autophagosomes in a section of hepatocyte in each genotype (mean ± SD; n = 60). *p < 0.001.

