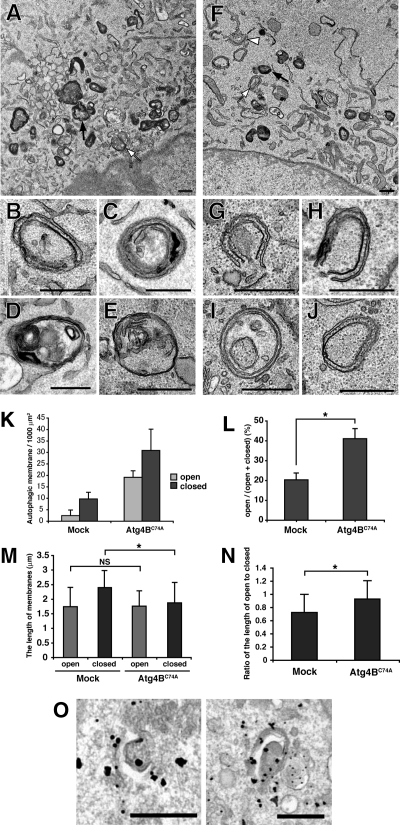
Figure 6.
Ultrastructual analysis of autophagic membranes in Atg4BC74A-overexpressing cells. NIH3T3 cells stably expressing empty vector (Mock) (A–E) or mStrawberry-Atg4BC74A (F–J) were cultured in HBSS for 1 h, fixed, and subjected to conventional electron microscopic analysis. (B–E) Typical autophagic structures in mock cells; isolation membrane (B), autophagosomes (C–E). (G–J) Typical autophagic structures in mStrawberry-Atg4BC74A-expressing cells; isolation membranes (G and H), closed double-membrane structures (I and J). Examples of electron-dense structures (black arrows), closed autophagic membranes (white arrows), and open autophagic membranes (white arrowheads) are indicated. Bar, 500 nm. (K) The number of autophagic structures in mock and mStrawberry-Atg4BC74A-expressing cells. ▩, open autophagic structures; ■, closed autophagic structures. Data are the means ± SD of triplicates from representative experiments. (L) The ratio of open structures to total autophagic structures. Data are the means ± SD of triplicates from representative experiments. *p < 0.05. (M) The length of autophagic membranes in mock and mStrawberry-Atg4BC74A-expressing cells. ▩, open autophagic structures; ■, closed autophagic structures. For the length of autophagic membranes determination, ImageJ version 1.40 was used (http://rsb.info.nih.gov/ij/). The value indicated is the mean ± SD. At least 20 samples were examined for each structure. *p < 0.05; NS, not significant. (N) The ratio of the length of open to closed autophagic structures in mock and mStrawberry-Atg4BC74A-expressing cells. *p < 0.05. (O) NIH3T3 cells expressing both GFP-Atg5 and mStrawberry-Atg4BC74A were grown in HBSS for 1 h and fixed. The localization of GFP-Atg5 was examined by gold-enhanced immunogold electron microscopy using an anti-GFP antibody. Bar, 500 nm.

