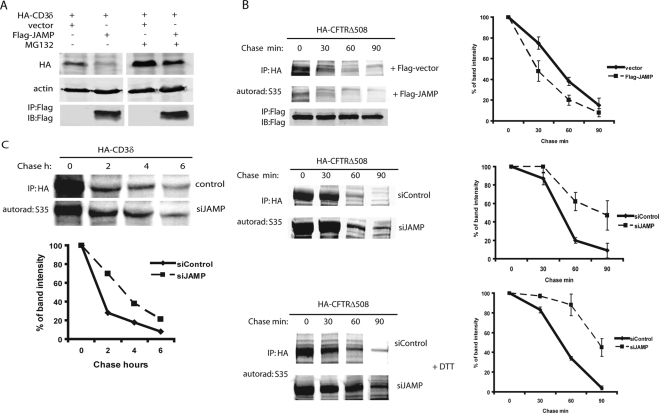
Figure 5.
JAMP promotes degradation of ERAD substrates and malfolded proteins. (A) JAMP promotes degradation of CD3δ in a proteasome-dependent manner. 293T cells were cotransfected with HA-CD3δ and Flag-JAMP (3:1 ratio) or empty vector. Cells were treated with MG132 (5 h; 40 μM) and subjected to immunoblot analysis as indicated. β-actin served as loading control. (B) JAMP expression facilitates degradation of misfolded proteins. Top, Overexpression of Flag-JAMP promotes degradation of the ERAD substrate CFTRΔ508. HeLa cells were cotransfected with HA-CFTRΔ508/vector, or CFTRΔ508/Flag-JAMP (ratio 1:1), and 24 h later cells were subjected to pulse-chase analysis using 35S-labeling (see Materials and Methods for details). Proteins collected at the indicated time points were subjected to IP with antibodies to HA (CFTRΔ508) followed by exposure to autoradiography and quantification by phosphorimager. Image shown represent example of autorad, and graphs the quantification of three experiments. Middle panel, siRNA of JAMP prolongs the half-life of CFTRΔ508. Experiment was performed as indicated above, except that cells that stably express siRNA JAMP (and control siRNA) were transfected with HA-CFTRΔ508 and subjected to pulse-chase analysis. Autorad depicts a representative analysis and graph represents three analyses which were quantified using phosphorimager. Bottom panel, siRNA of JAMP prolongs half-life of HA-CFTRΔ508 after ER stress. Experiment was performed as indicated above, except that cells were subjected to DTT treatment 3 h before the addition of 35S-labeled methionine/cysteine mix for pulse-chase analysis. Right panel depicts results of three analyses which were quantified using phosphorimager. (C) siRNA of JAMP prolongs the half-life of CD3δ. Experiment was performed as indicated in B, except that cells that stably express siRNA JAMP were transfected with CD3δ before subjected to pulse-chase analysis using 35S-labeled methionine/cysteine mix. Bottom panel depicts results of three analyses that were quantified using the phosphorimager.

