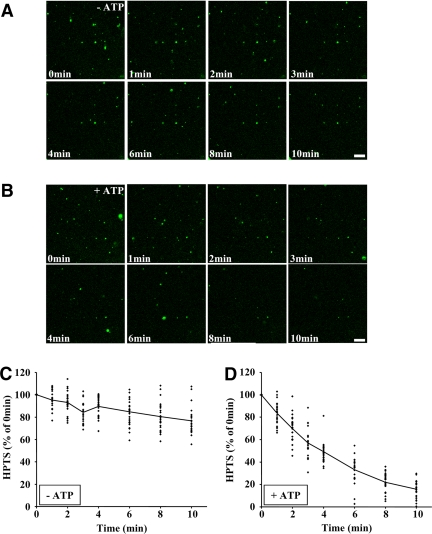
Figure 4.
In vitro assay measuring HPTS release via back-fusion. (A and B) The in vitro assay was performed with protocol 1 (Figure 1A) to load newly formed lumenal vesicles with HPTS. After fractionation, late endosomes, which had been preloaded with HPTS, were reincubated using protocol 2 but without HPTS, in the absence (A) or presence (B) of ATP. The process was followed by videomicroscopy for 10 min at 37°C and frames were captured at the indicated times. Bars, 20 μm. (C and D) HPTS fluorescence was quantified at each time point in the experiments shown in A and B in the absence (C) or presence (D) of ATP, for 25 structures from three independent experiments. Values are expressed as a percentage of the fluorescence measured at t = 0 min, with the solid line showing the average.

