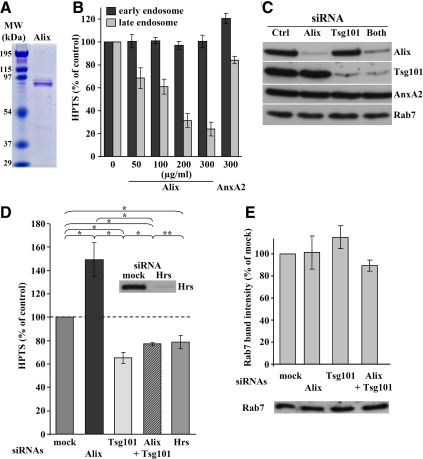
Figure 6.
Effects of Alix and Tsg101 down-expression on budding in vitro. (A) The purified recombinant Alix was analyzed by SDS-PAGE, and the gel was stained with Coomassie blue. The left lane shows the indicated MW markers. (B) Recombinant Alix or Annexin A2 (AnxA2) was added at the indicated concentrations during the in vitro assay with protocol 1 (Figure 1A). After DPX quenching and cell fractionation, remaining HPTS fluorescence associated with early and late endosome fractions was measured and is expressed as a percentage of the controls. Means (± SEM) of three independent experiments are shown. (C) After treatment with control siRNA, siRNAs against Alix, Tsg101, or both, PNSs were prepared and analyzed by immunoblotting, as indicated. (D) The in vitro assay with protocol 1 (Figure 1A) was performed after knockdown of the indicated proteins with siRNAs. Means (± SEM) of HPTS fluorescence associated with late endosome fractions from at least five independent experiments per condition are represented. The chi-square test shows that each value is significantly different from the others (* p < 0.01), except when indicated (** p > 0.01). Inset, Hrs knockdown analyzed by Western blotting. (E) Cells were treated with siRNAs as in C and D. Late endosomes were prepared and analyzed by Western blotting with antibodies against Rab7. Western blots were quantified and means (± SEM) of three independent experiments are shown as percentages of the mock-treated controls.

