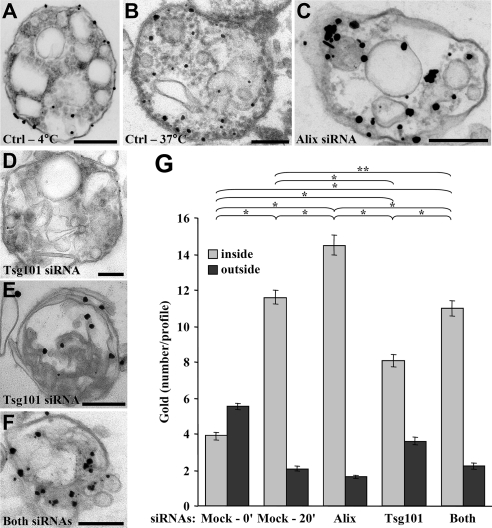
Figure 9.
Ultrastructural analysis after Alix and Tsg101 knockdown. (A–F) Cells were first treated with control siRNAs (A and B) or siRNAs against Alix (C), Tsg101 (D and E), or both (F), as in Figure 6, C–E. Then, PNSs were prepared, used in the in vitro assay for 0 min (A) or 20 min (B–F) at 37°C in the presence of nanogold (Figure 1A, protocol 1), and processed for electron microscopy as in Figure 3, A and B. (A and F) Representatives of three independent experiments. Bars, 200 nm. (G) The number of nanogold particles per profile in A–F was quantified. The chi-square test shows that the values for single knockdowns are significantly different (* p < 0.01), whereas the double Alix-Tsg101 knockdown is not significantly different from the positive control at 20 min (** p > 0.01). Means (± SEM) of three independent experiments are shown.

