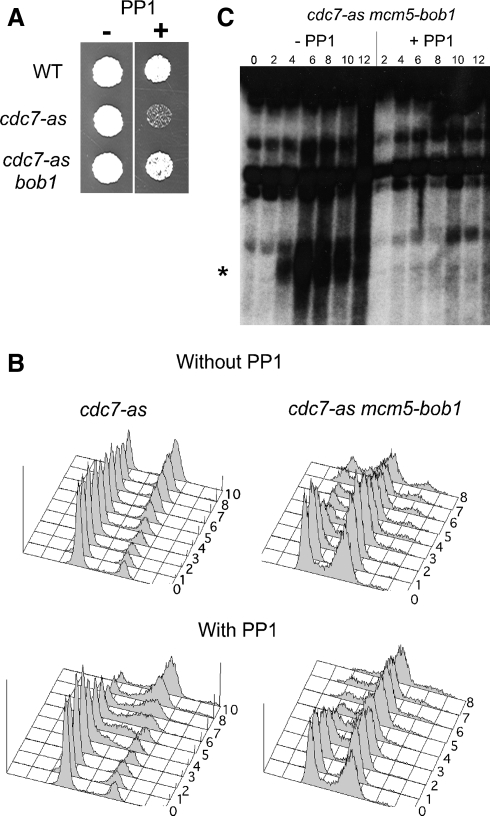
Figure 1.
Effect of PP1 on cdc7-as mcm5-bob1 strains. (A) Vegetative growth on YPD plates with or without 30 μM PP1. (B) NH452F (cdc7-as) and NH661 (cdc7-as mcm5-bob1) were analyzed by flow cytometry at 1-h intervals (indicated by numbers on the plots) after transfer to Spo medium in a time course with and without 15 μM PP1. The cdc7-as data have been published previously (Wan et al., 2006). (C) DSBs at the YCR048w hot spot (Wu and Lichten 1994). The asterisk indicates the DSB bands.

