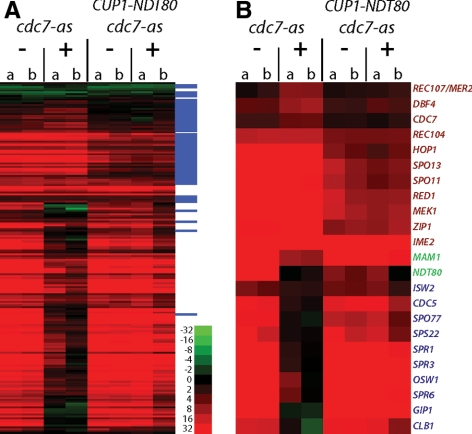
Figure 2.
Microarray analysis of RNAs from meiotic cells under various conditions. (A) Expression profile of ∼200 previously identified sporulation-specific genes at 10 h in cdc7-as (NH452F) and cdc7-asNDT80 (NH452F:CUP1-NDT80) with and without inhibitor. Relative RNA abundance in the indicated strains with (+) or without (−) 15 μM PP1 was determined by competitive hybridization to a T0 control. Early genes are tagged with a blue line in the far right column. Red indicates induction, green repression. Although the data exhibited a dynamic range of 216, only a range of 26 is shown here. Two independent colonies (a and b) were assayed. (B) Subset of specific genes from the data set in A. Early genes are indicated in red, delayed early genes in green, and middle sporulation genes in blue.

