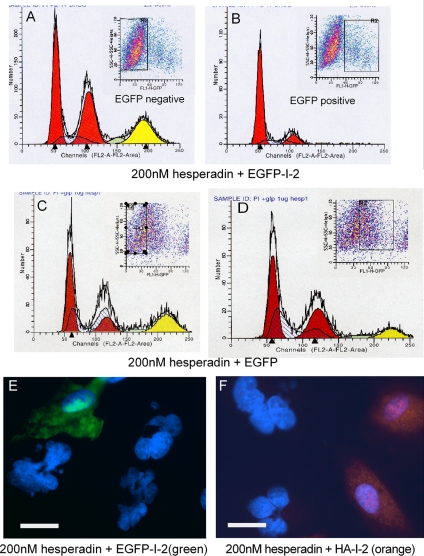
Figure 8.
Ectopic expression of I-2 prevents mitotic defects generated by hesperadin inhibition of Aurora B. (A–D) ARPE-19 cells were transfected to express EGFP-I-2 (A and B) or EGFP, as a control (C and D), and incubated with 200 nM hesperadin for 24 h. Finally, cells were fixed and subjected to fluorescent activated cell sorting. The cell population was sorted into EGFP-negative (A and C) and EGFP-positive (B and D) populations, marked by the rectangle in each FACS profile. The DNA content of each subset was determined by flow cytometry based on propidium iodide staining, in three independent experiments. Representative profiles are shown. Red peaks mark cell populations with 2N or 4N DNA content; yellow peaks designate cell populations with 8N DNA content. (E and F) Cells expressing either EGFP-I-2 or HA-I-2 were treated with 200 nM hesperadin for 24 h, fixed, and examined by immunofluorescent microscopy. (E) The EGFP (green)-positive cells had single, normal-sized nuclei compared with neighboring EGFP-negative cells that had multiple nuclei or abnormally large nuclei. (F) HA (orange)-positive cells with single, normal-sized nuclei were compared with neighboring HA-negative cells with abnormal nuclei containing extra DNA. Bars, 25 μm (E and F).

