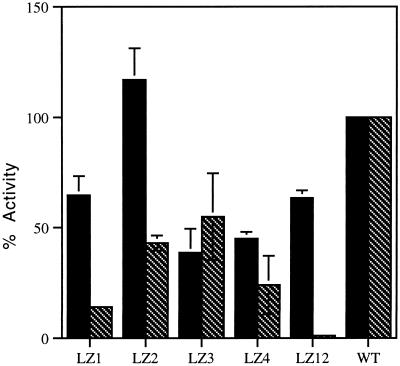
Figure 3.
Relative cell surface expression and fusion activity of GP64 mutants. Cell surface expression (black bars) was determined by cELISA. Values represent the means from three separate experiments normalized to optical density signal from wild-type GP64 (100%). Relative cell-to-cell fusion activities (hatched bars) were determined by PKH26-membrane dye transfer from fusion target RBCs to fusion protein–expressing Sf9 cells. Values represent the means from three separate experiments normalized to wild-type GP64 (100%). Error bars represent SE. For mutants LZ13, LZ14, LZ23, and LZ34, all cell surface and relative fusion levels were <5% of wild-type values (data not shown).

