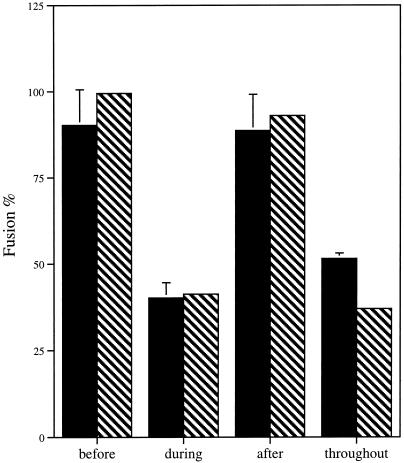
Figure 5.
Stage of peptide inhibition. The effect of the presence or absence of 10 μg/ml GP64 peptide was determined before, during, or after induction of membrane fusion on transiently GP64-transfected Sf9 cell lines. “Before” data represent GP64-expressing Sf9 cells exposed to the GP64 peptide 10 min before the addition of fusion-inducing PBS, pH 5.0. “During” data represent the presence of GP64 peptide in PBS, pH 5.0. “After” data represent the presence of GP64 peptide in PBS, pH 7.4, added immediately after the 5-min induction with acidic pH. “Throughout” data represent the presence of GP64 peptide 10 min before induction, during the 5-min induction period in PBS, pH 5.0, and after the induction period in PBS, pH 7.4. The extent of membrane fusion was determined by counting fluorescently labeled Sf9 cells (fusion event) and dividing by the sum of PKH26-labeled RBCs in contact with Sf9 cells and fluorescently labeled Sf9 cells. The extent of syncytia formation was determined by dividing fused Sf9 cells by the sum of fused Sf9 cells and nonfused cells in contact. Black bars represent mean values from three separate Sf9-RBC experiments normalized to wild-type GP64 (100%) in the absence of the GP64 peptide. Hatched bars represent average values from two separate Sf9-Sf9 syncytia experiments normalized to wild-type GP64 (100%) in the absence of the GP64 peptide. Error bars represent SE.

