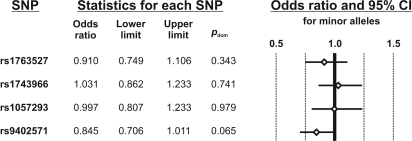
Figure 3. Diabetes risk (METSIM study) according to SGK genetic variability.
The odds ratio, 95% confidence intervals (CI) and forest plot for the endpoint “type 2 diabetes” are presented for the minor alleles of each SGK tagging SNP. N = 658 diabetic and N = 3746 non-diabetic subjects of the Finish METSIM study cohort were investigated. The p-values were calculated for a dominant model. SNP = single nucleotide polymorphism.

