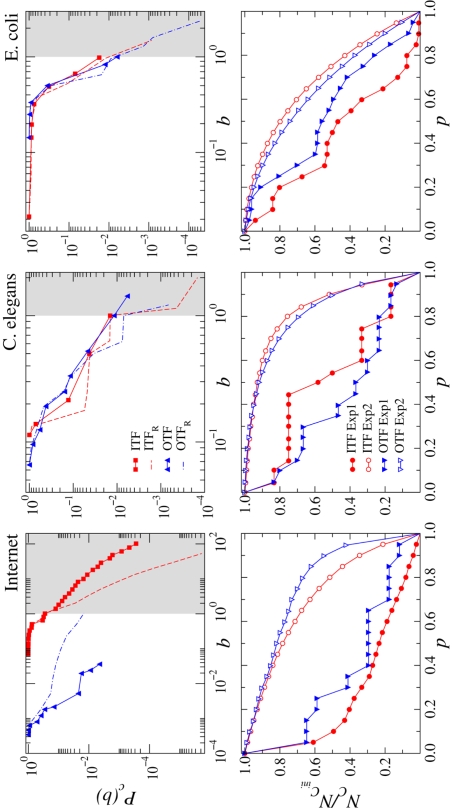
Figure 3.
Top plots. Cumulative random-walk betweenness distribution for the in- and out-interfaces. The empirical distributions (symbol lines) are compared against those for the randomized null models (dashed lines). Grey areas denote stress regions with loads above 1. The steps observed for the distributions of the randomized version of the C. elegans network (more important for its ITF) are due to the small size of the peripheral component (only 12 nodes in the case of the IN) along to its structure with all nodes directly connected to the core though multiple edges. The small size of the peripheral component brings out the quantization in the number of connections per node at the interface, and this affects the distribution of loads. This structural effect, determined by the degree distribution, cannot be smoothed by the randomization procedure. Bottom plots. Fraction of nodes remaining in the peripheral components after removing a fraction p of edges of the corresponding interfaces. Two different experiments are performed and compared with each other, always on the real networks. In Experiment 1 (full symbol lines), a targeted removal of edges at the interfaces is performed in decreasing order of load as measured in the original network. In Experiment 2 (open symbol lines), the order of edge deletion at the interfaces is random and also applied to the original networks under analysis. In this case, averages are shown over 100 different realizations of random orderings of the edges.

