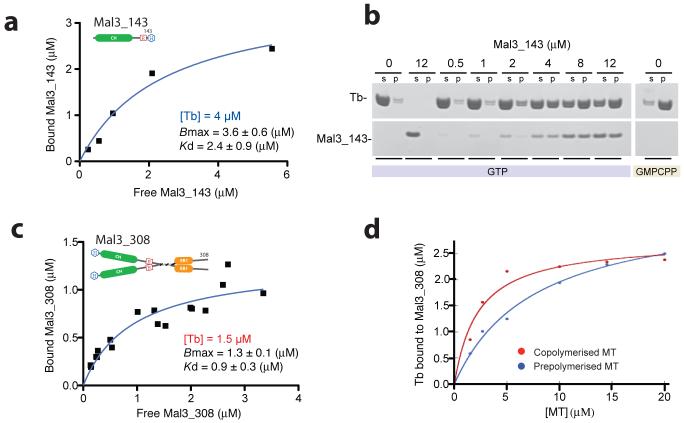
Figure 2.
Mal3 binding to microtubules in vitro. (a) Binding of Mal3-143 to GMPCPP-stabilized S. pombe microtubules, as quantified by SDS-PAGE. The graph shows a single experiment and gave a fitted Kd of 2.4 ± 0.9 (±S.E.) μM. (b) Typical gel run for a pelleting assay. In this case, Mal3-143 (added concentrations, 0-12 μM, are indicated above the lanes) and 8 μM of S. pombe tubulin (Tb) heterodimers were copolymerized in the presence of 1 mM GTP or GMPCPP. s, supernatant fraction; p, pellet fraction. (Curves plotted for the samples with GTP are shown in Supplementary Fig. 2a.). (c) Binding of Mal3-308 to GMPCPP-stabilized S. pombe microtubules. The graph contains all the data points from three independent experiments. For the fitted curve, Bmax 1.3 ± 0.14 (±S.E.) μM and Kd 0.93 ± 0.28 (± S.E.) μM (giving 95% confidence intervals of 0.98-1.6 μM for Bmax and 0.35-1.5 μM for Kd). (d) Binding of 2.5 μM Mal3-308 to pig brain microtubules (MT), either after coassembly with tubulin (red) or after being mixed with preassembled GMPCPP-stabilized microtubules (blue). The data points shown are the result of one experiment. Two other experiments, using either GMPCPP or Taxol to stabilize the preassembled microtubules, gave similar differences from coassembled samples.

