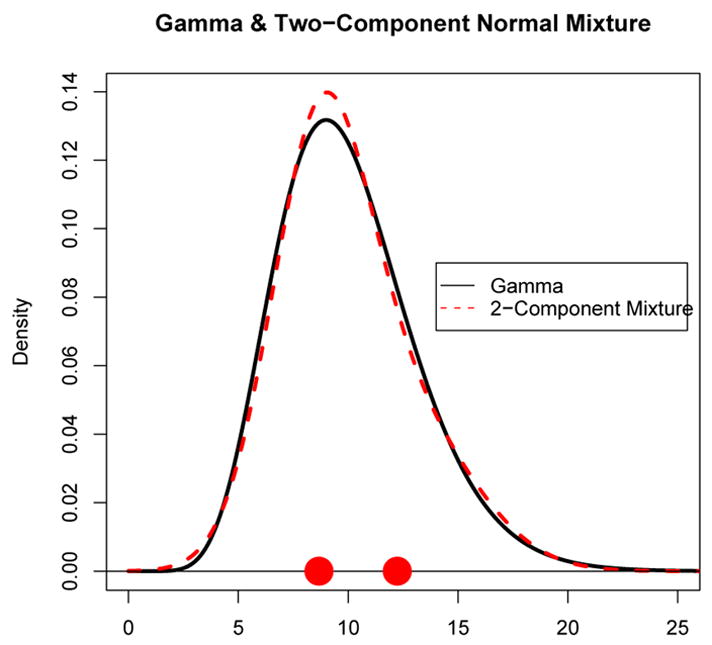
Figure 3.

A gamma density (solid curve) with parameters θ = 1, κ = 10 and a two-component normal mixture density (dashed curve) obtained by running the EM algorithm on the gamma distribution. The two points on the x-axis represent the normal mixture component means.
