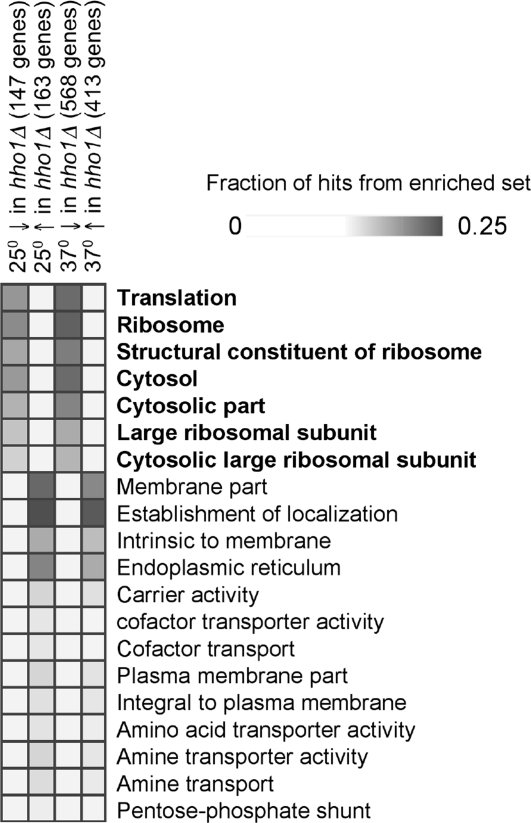
Fig. 4.
GO ontology of gene lists generated by expression microarray analysis. The fraction of hits from sets that are found in different GO ontology sets are displayed graphically (36). Here, we show only 20 of the categories. The analysis shown here was performed on gene sets after removal of genes expressed at a very low level (<500 units in the raw data). Above each column, the title relates to whether the gene set was higher (↑) or lower (↓) in the hho1Δ mutant than the wild type, and how many genes were in each set (in parentheses). GO ontologies that relate to translation are bolded. The complete figure and quantitative results can be found in Fig. S1.

