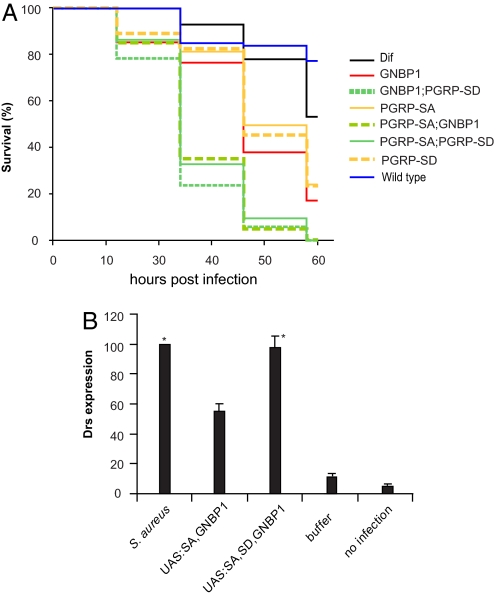
Fig. 5.
PGRP-SD, PGRPSA, and GNBP1 during host receptor signaling in vivo. (A) Kaplan–Meier analysis of survival experiments after Sa infection using double or single mutants of host receptors were carried out. Survival tests were performed in three independent experiments. Log-rank tests comparing the three experiments for each genotype indicated that the experiments were homogeneous (all P values very high and in the range of 0.7–0.98). Thus, it was valid to pool these experiments and for each genotype to analyze the data for all flies used. Because there were 35 pairwise tests between different genotypes there was an issue of multiplicity of tests. To address that, we used the Bonferroni correction for multiple tests (0.05 divided by the number of tests). This placed P values for significance at or <0.0014. The log-rank tests for the comparisons of the 8 genotypes presented in the graph gave P values that clearly placed the WT and Dif flies in one group (WT vs. Dif, P = 0.214), the single mutants in a second group, and the double mutants in a third group, whereby the statistical difference between all single vs. double mutant tests was significant (P < 0.0005) as judged by: GNBP1 vs. GNBP1, PGRP-SD, P < 0.0005; GNBP1 vs. PGRP-SA; GNBP1, P < 0.0005; PGRP-SA vs. PGRP-SA; PGRP-SD, P < 0.0005; PGRP-SA vs. PGRP-SA; GNBP1, P < 0.0005; PGRP-SD vs. PGRP-SD, GNBP1, P < 0.0005; and PGRP-SD vs. PGRP-SA; PGRP-SD, P < 0.0005. All single or double mutant combinations vs. the WT gave P < 0.0005. Differences between the single mutants were not statistically significant (GNBP1 vs. PGRP-SA, P = 0.003; GNBP1 vs. PGRP-SD, P = 0.033; PGRP-SA vs. PGRP-SD, P = 0.428). Finally, differences between double mutants were also not statistically significant (GNBP1, PGRP-SD vs. PGRP-SA; GNBP1, P = 0.008; GNBP1, PGRP-SD vs. PGRP-SA; PGRP-SD, P = 0.007; and PGRP-SA; GNBP1 vs. PGRP-SA; PGRP-SD, P = 0.512). (B) Concomitant overexpression of PGRP-SA and GNBP1 through the GAL4/UAS system results in activation of the AMP gene drosomycin (drs) used as a read-out for activation of the Toll pathway. This activation occurs in the absence of any immune challenge and amounts to 40% of drs induction after infection. Expressing PGRP-SD through a UAS-transgene at the same time as PGRP-SA and GNBP1 induces drs at the level seen by Gram-positive bacterial infection (S. aureus). Columns represent the percentage mean value of three independent experiments (corrected against the loading control RP49) with standard deviation represented as error bars. Asterisks indicate values that are not statistically different (P > 0.005) from each other. All other differences are statistically significant (P < 0.005).

