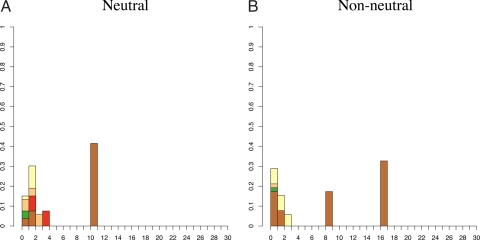
Fig. 2.
Example haplotype distributions. The height of column i is the number of individuals whose haplotype is represented i times in the sample (normalized by sample size). (A) An example of a community haplotype distribution that does not show evidence of departure from neutrality based on the exact test: Sumba/Mamboro. (B) An example of a community showing departure from neutrality based on the exact test: Sumba/Wanokaka. Although nonneutral cases often appear to have mass shifted to the right, it generally is not possible to determine the outcome of the exact test by inspection. Colors indicate Y chromosome haplogroup membership (C, F, K, M, O, or S). All 41 distributions and the color key are given in Fig. S1. Additional haplogroup information is in Table S5.

