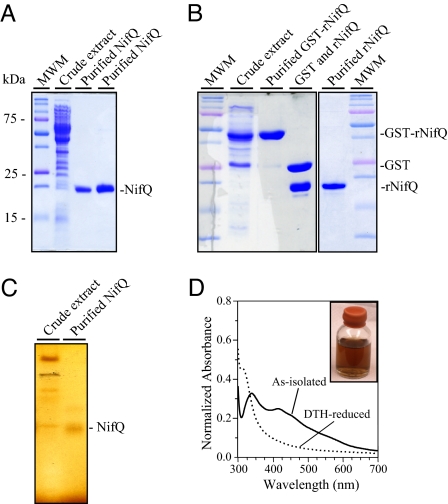
Fig. 1.
Purification and UV-visible spectra of native A. vinelandii NifQ and recombinant rNifQ. (A) SDS/PAGE analysis of A. vinelandii NifQ purification steps (cell-free extract lane contains 40 μg of protein; purified NifQ lanes contain 5 μg and 15 μg of protein, respectively). Molecular weight markers are indicated to the left. The position of NifQ is indicated to the right. (B) SDS/PAGE analysis of recombinant rNifQ purification steps (cell-free extract lane contains 25 μg of protein; purified protein lanes contain 8 μg of protein). Protein positions in the gel are indicated to the right. (C) Fe staining of NifQ purified from A. vinelandii cells after anoxic native PAGE (cell-free extract lane contains 100 μg of protein; purified NifQ lane contains 25 μg of protein). (D) UV-visible spectra of as-isolated NifQ (solid line) and DTH-reduced NifQ (dotted line). DTH-treated NifQ samples (33 μM NifQ) were gel-filtered on a Sephadex G-25 resin to remove excess DTH before recording the spectrum. Spectra were normalized by absorbance at 280 nm.

