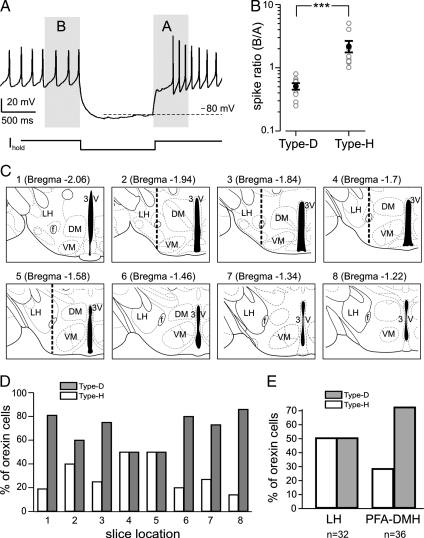
Fig. 2.
Electrical and anatomical properties of adaptive and nonadaptive cells. (A) Electrical fingerprint protocol showing time regions analyzed in B. (B) Spike ratios (see text) of Type-D (adaptive) and Type-H (nonadaptive) cells. Gray circles are raw data, black circles and bars are means ±SEM. ***, P <0.005. (C) Schematic drawings of coronal hypothalamic slices from which we recorded. Corresponding adult Bregma coordinates are given in brackets. In slices 3–5, the dotted vertical line shows the border between LH and PFA-DMH used to collect data in E. (D) Anterioposterior distribution of the two cell types. Proportions of Type-D and Type-H cells are given as percentages of total number of orexin neurons recorded in the series of slices shown in C (n = 128 cells). (E) Lateromedial distribution of the two cell types. Proportions of Type-D and Type-H cells are given as percentages of total number of orexin neurons recorded in LH and PFA-DMH regions (left and right sides respectively of the vertical dotted line in slices 3–5.

