Fig. 2.
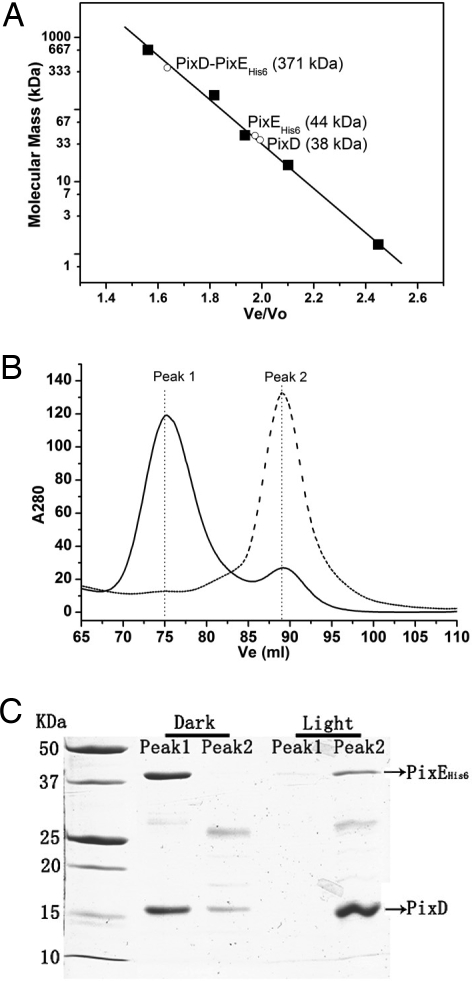
Gel filtration profile of purified PixD, PixE, and the PixD–PixEHis-6 complex under dark and light conditions. (A) Graph of molecular mass vs. elution volume (Ve/Vo) of molecular mass standards from Bio-Rad (■). The observed Ve/Vo of isolated PixD, PixE and the PixD–PixEHis-6 complex in the dark are shown as ○ with the calculated molecular mass indicated in brackets in kDa. (B) Dark Ni2+ affinity-purified PixD–PixEHis-6 complex was divided into two equal portions and then assayed for oligomerization state with Superose 6 10/300 gel filtration chromatography under dark (solid line) or illuminated conditions (dashed line). (C) Fractions from peaks 1 and 2 in B were analyzed by SDS/PAGE and stained with Coomassie brilliant blue G-250.

