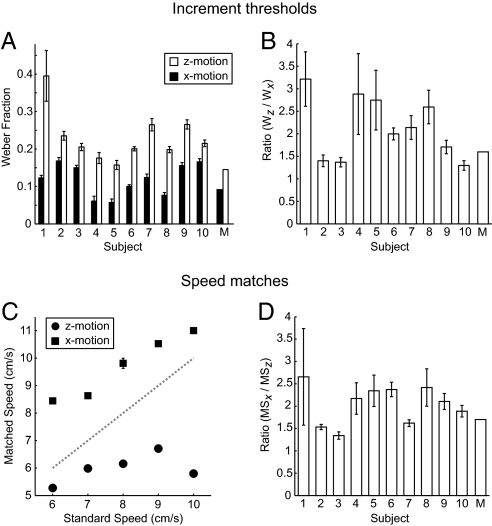
Fig. 2.
Perceptual assays of lateral motion and motion-in-depth. (A) Increment thresholds, expressed as a Weber fraction, for motion in the plane of the computer screen (Vx motion) and motion in the mid-sagittal plane (Vz motion). Results from 10 observers and model simulations (M) are shown. Error bars show SE of the increment threshold estimate. (B) Ratio of Weber fractions (Wz/Wx) for each observer and the Bayesian model. Error bars show SE estimates of the ratio. (C) Speed match data from one observer. Square markers depict data obtained when the observer adjusted motion-in-depth (Vz) to match lateral motion (Vx). Circular markers show data obtained when observers adjusted Vx to Vz. The dotted diagonal line represents perceived speed of Vx equals perceived speed of Vz. Error bars (not all visible) depict the SE of the speed match. For each observer, the mean speed match ratio (MSx/MSz) was calculated across the presented standard speeds. (D) Ratio of speed matches for all 10 observers and the Bayesian model (M). Error bars represent SEM.

