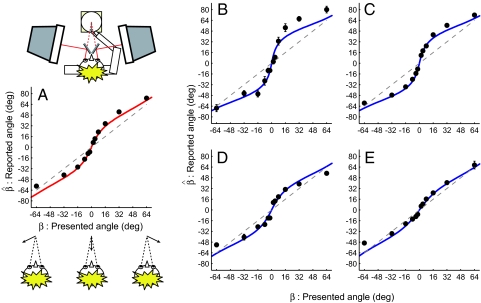
Fig. 3.
Reports of approach angle. (A) Between-subject mean reported angle as a function of presented angle (n = 10). A sketch of the apparatus (observer, pointing device, and CRT stereoscope) is presented above the graph. Error bars (±SEM) lie within the plotting symbols. The dashed diagonal line depicts reported angle equal to presented angle. The sigmoidal curve shows the performance of the Bayesian model. (B–E) Plots of reported trajectories from the two subjects who had the highest (B and C) and lowest (D and E) ratios of differences in sensitivity/speed matches for Vx and Vz targets. Note the differential extent of bias. Error bars depict SEM. The sigmoidal curve shows the Bayesian model; unlike A, the model is fit to these data by adjusting the ratio between the variability of the likelihood distribution along the Vx and Vz dimensions.

