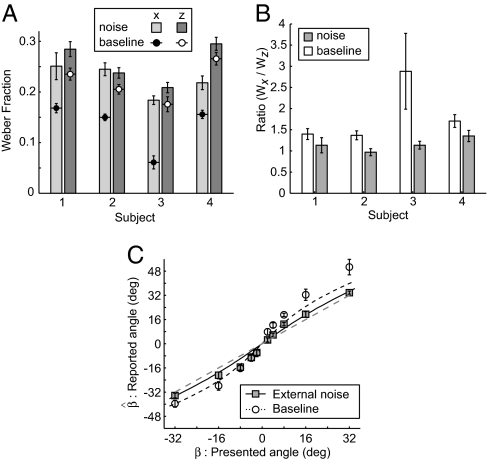
Fig. 4.
Results of the noise-masking experiment. (A) Increment thresholds for motion-in-depth (Vz) and lateral motion (Vx) in the absence (baseline) and presence of a noise mask. Error bars show SE of the increment threshold estimate. (B) Ratio of distance increment thresholds in the absence (white bars) and presence (gray bars) of the noise mask. Error bars show SE estimates of the ratio. (C) Between-subject mean reported angle as a function of presented angle (n = 4). Open symbols show data obtained without the noise mask present. Filled symbols data obtained in the presence of the noise mask. Error bars represent SEM. The sigmoidal curves show model predictions in which the ratio of increment thresholds from A is used to model the ratio of the variability of the likelihood distribution along the Vx and Vz dimensions.

