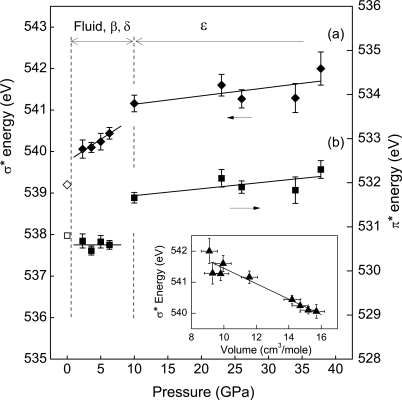
Fig. 2.
Variation in the σ* and π* transition energies of oxygen with pressure, in (A) and (B) respectively. Open symbols represent data for gas-phase O2 (18), solid symbols the high-pressure phases, and the solid lines are linear fits to the data. The correlation between σ* transition energy and volume is shown in the Inset.

