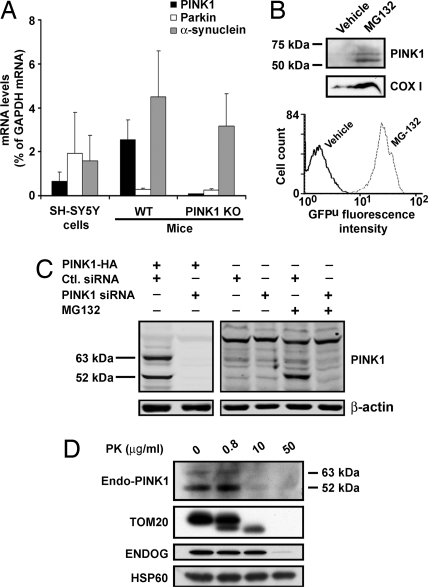
Fig. 3.
Topology of endogenous PINK1 using PINK1175–250 antibody. (A) mRNA levels of endogenous PINK1, parkin, and α-synuclein in SH-SY5Y cells and in PINK1 wild-type (WT) and knockout (KO) mouse brain. Total RNA extracted from each sample is quantified by real-time PCR (n = 3). Values represent means ± SD. PINK1 mRNA in KO mouse brain is below the limit of detection. (B) Using the antibody PINK1175–250, there is no detectable signal for endogenous PINK1 in SH-SY5Y cells (vehicle control, left lane), whereas endogenous PINK1 is detected in the presence of the proteasome inhibitor MG132 (right lane). Western blot analysis of mitochondrial fractions shows an increased level of COX I with MG132 treatment. Accumulation of GFPu, as shown by the increased GFP fluorescence intensity, indicates the successful inhibition of the proteasome pathway by MG132. (C) siRNA knockdown of PINK1. (Left) HeLa cells are cotransfected with either PINK1-HA/scramble control siRNA or PINK1-HA/PINK1 siRNA. Overexpressed full-length PINK1 and truncated ≈52-kDa PINK1 are diminished specifically by the PINK1 siRNA. (Right) Endogenous PINK1 is barely detected in whole HeLa cell lysates in the absence of MG-132, but it is clearly detected in the presence of MG-132. Endogenous PINK1 signals are markedly reduced by the PINK1 siRNA knockdown. (D) After MG132 treatment of SH-SY5Y cells, mitochondria are isolated and processed for PK protection assay as in Fig. 2.

