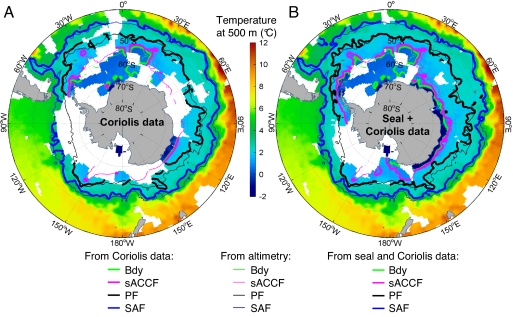
Fig. 2.
Temperature field at 500 m during 2004–2005 from the Coriolis database and from the merged Coriolis and elephant seal databases. Mean front positions during the same period derived from Coriolis (A) or Coriolis and seal temperature field at 500 m (B) (thick lines), and from altimetry (thin lines in A and B). Plotted fronts are Bdy, southern branch of sACCf, and central branches of PF and SAF. Note the increased level of detail in the combined plots.

