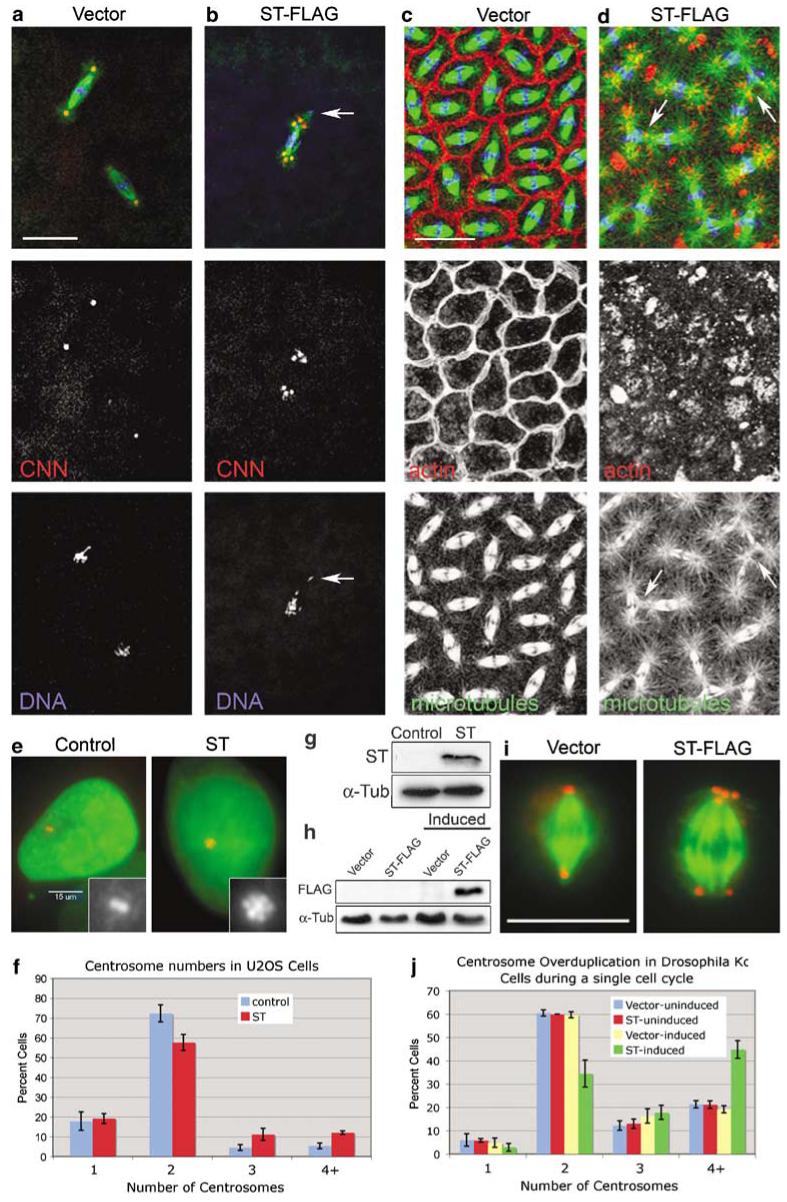
Figure 2.

Small tumor antigen (ST) induces centrosome overduplication and cytoskeleton disruption. (a, b) Expression of FLAG-tagged ST causes centrosome overduplication and chromosome segregation errors from the earliest embryonic divisions. Spindles in ST-FLAG embryos have extra centrosomes at spindle poles and scattered arrangement of chromosomes, some displaced completely from the spindle (arrow in (b)). Embryos were stained for α-tubulin (green), centrosomin (CNN) (red) and DNA (blue). At cortical cleavage stages (c, d) actin is not assembled properly into furrows, astral microtubules are larger and interact with neighboring spindles in ST embryos (arrows in (d)). (c, d) Embryos were stained for α-tubulin (green), filamentous actin (red) and DNA (blue). (e) In human U2OS cells, ST expression increases centrosome numbers. Cells transfected with pGFP-histone (a marker for transfected cells) with or without the ST expression plasmid pCMV5/Smt (Sontag et al., 1993)were stained for γ-tubulin (red) and green fluorescent protein (GFP) (green). Insets show the centrosomes; note the flower-like arrangement of the multiple centrosomes in ST-expressing cells. (f) Quantitation of supernumerary centrosomes in human U2OS cells. Mean±s.d. (23.2±3.9%) of ST-expressing cells had >2 centrosomes, versus 9.8±2.9% in control cells. n = 200 cells per sample for three independent experiments. (g) Western blot for ST expression in U2OS cells. (h) Western blot for ST-FLAG expression in Drosophila Kc cells. Lanes labeled ‘Induced’ were exposed to 1.0 mM CuSO4 for 20 h. Detection of α-tubulin in each blot was used as a loading control. (i) Supernumerary centrosomes in Kc cells following induction of ST-FLAG. Cells were stained for α-tubulin (green) and CNN (red). (j) Quantitation of centrosome overduplication in Kc cells. Mitotic cells were counted following a 20 h induction period. Four or more centrosomes were found in 44.8±3.8% (mean±s.d.)of ST-induced cells versus 21.2±1.6% for uninduced ST cells; n = 200 cells per sample for three independent experiments. Bars: 25 μm in (a, b), 15 μm in (c, d, e) and 10 μm in (i).
