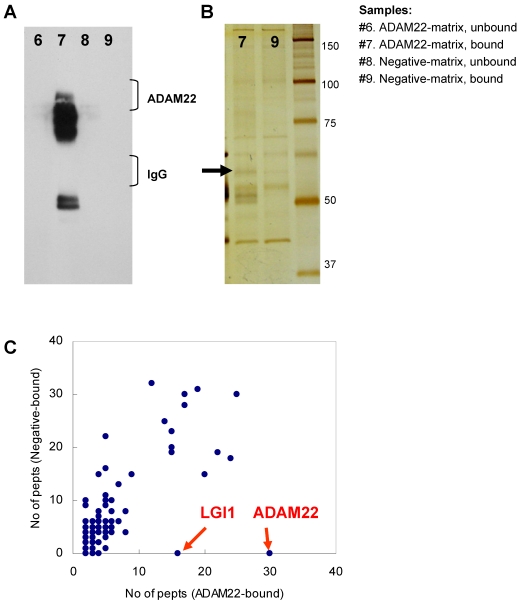
Figure 2.
Comparative GeLC-MS analysis for ADAM22-matrix bound proteins and negative-matrix bound proteins. A) Immunoblot analysis. Each sample was examined by immunoblot analysis using anti-ADAM22-cyto antibody. B) Silver stain analysis. The 60-kDa specific band is indicated by an arrow. Note that the amount of IgG was greatly decreased in sample #9. C) The number of identified peptides for 113 proteins from the ADAM22-matrix sample (x-axis) is plotted against that from the negative-matrix sample (y-axis). These 113 proteins are listed in Table 1.

