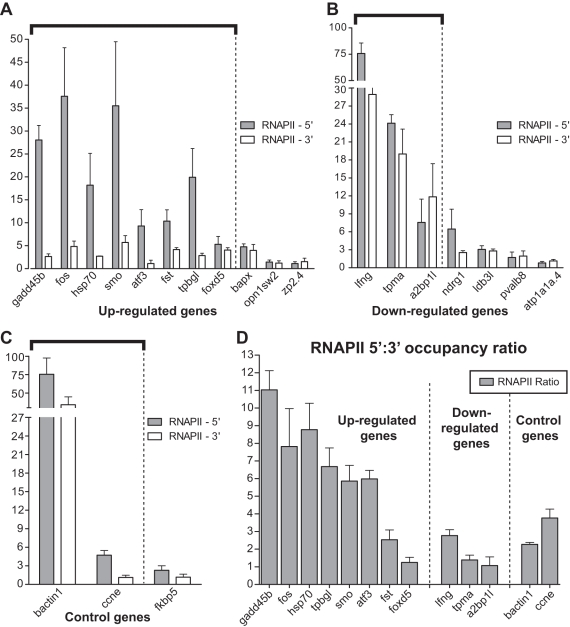
Figure 6. Distinct patterns of RNAPII occupancy at putative Spt5 target genes.
(A–D) ChIP data showing RNAPII occupancy in 24 hpf WT embryos on the genes that are up-regulated in fogsk8 embryos (A), genes that are down-regulated in fogsk8 embryos (B), control genes (C), and the ratio of RNAPII occupancy at 5′ vs 3′ end (D). Y-axis values in the graphs represent fold RNAPII occupancy over fold mouse control serum occupancy. Arbitrary cutoff for detectable RNAPII fold occupancy over control serum is set at 5. Thick black bars highlight the genes that display significant RNAPII occupancy at either 5′ or 3′ end of the chromatin. The results shown are the average of at least three independent replicates. Error bars are SEM values.

