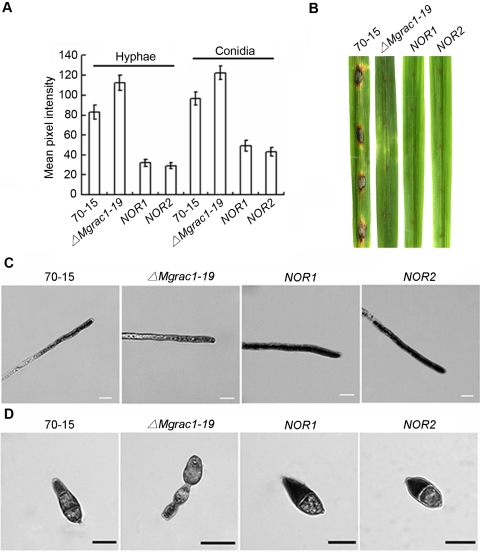
Figure 9. Superoxide production and pathogenicity of Nox over-expression mutants.
(A) Bar chart showing mean pixel intensity in hyphal tips and conidia of 70-15 (wild-type strain), ΔMgrac1-19 (the Mgrac1 deletion mutant), NOR1 (NOX1 over-expressed in ΔMgrac1-19), and NOR2 (NOX2 over-expressed in ΔMgrac1-19). Error bar means standard deviation based on the data of three independent experiments. Superoxide production was detected by NBT staining. (B) Disease symptoms on the wounded leaf tissues of rice inoculated with mycelial plugs from 70-15, ΔMgrac1-19, NOR1, and NOR2. (C) Detection of superoxide by 0.6 mM NBT staining in the hyphal tips of Nox over-expression mutants. Bar = 10 µm. (D) Detection of superoxide by 0.3 mM NBT staining in the conidia of Nox over-expression mutants. Bar = 10 µm.

