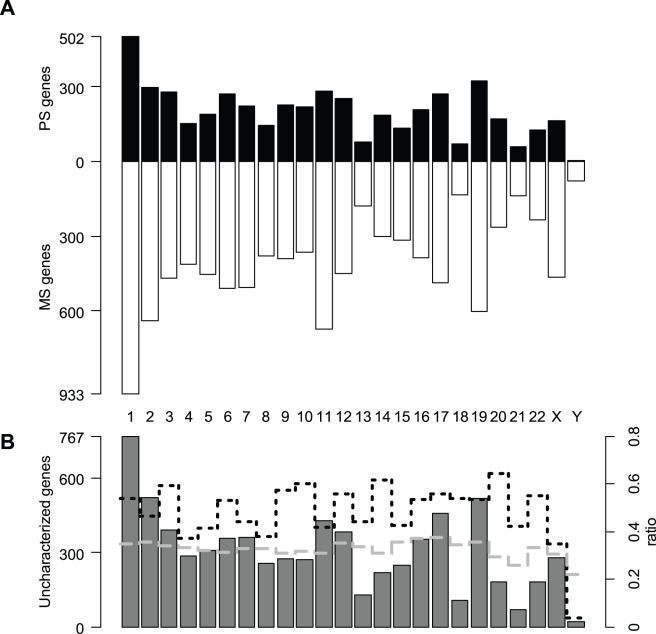
Figure 1. Chromosomal distribution of MS and PS genes in humans.
A. Contrast between the distributions of MS (white bars) and PS genes (black bars) across chromosomes, which are significantly different (χ2 = 118.387, df = 23, p<0.001). B. Chromosomal distribution of genes that cannot be assigned ot the MS or PS categories. The ratio of uncharacterized genes on the total number of ENSEMBL genes (grey dashed line) is approximately constant across chromosomes. The ratio of PS genes on MS genes (black dotted line) clearly drops for the Y chromosome and to a lesser extent for the X chromosome.

