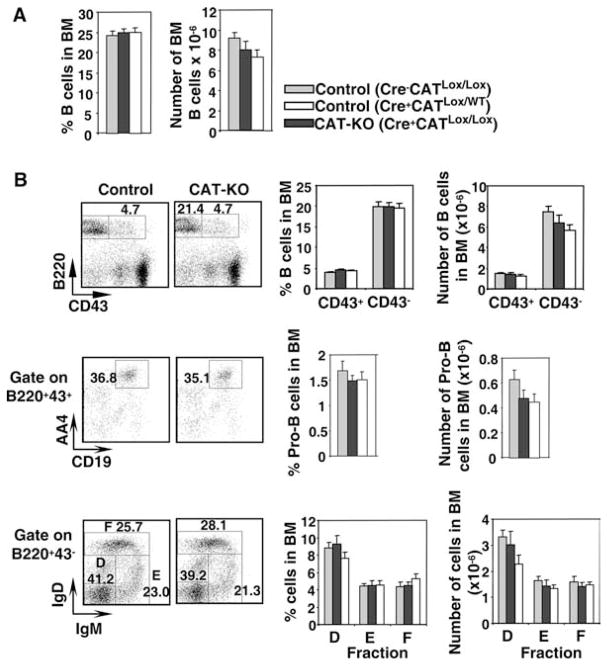
Figure 2.
B cell development in BM from CAT-KO mice. A, BM cells were isolated from femur of control or CAT-KO mice and stained for multiple markers. Left panel, Percentage of B220+ cells in BM; Right panel, Absolute number of B220+ in BM (n = 6). There were no statistically significant differences between either of the two controls and CAT-KO mice. B, Left top panel, CD43+B220+ cells and CD43−B220− cells in BM; Left middle panel, Pro-B cells defined as CD43+B220+ AA4.1+CD19+; Left bottom panel, Fractions D, E, and F in the CD43−B220+ population defined by expression of surface IgD and IgM. Graphs show percentage and number of the above populations in BM (n = 6). There were no statistically significant differences between either of the two controls and CAT-KO mice.

