Figure 3.
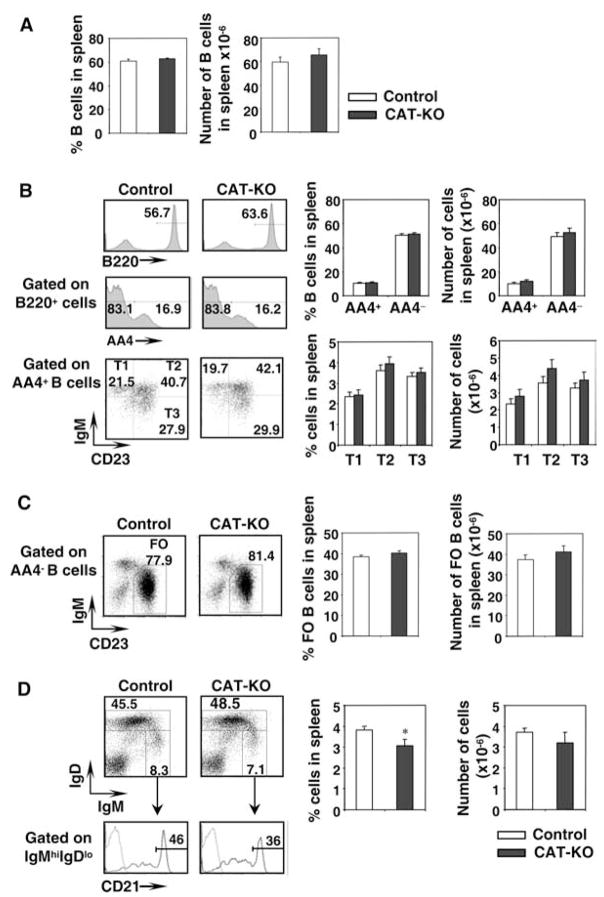
B cell maturation in spleen from CAT-KO mice. A, Percent and number of B cells in spleen. Spleen cells from control mice (include both Cre−CATlox/lox and Cre+CATlox/wt mice) or CAT-KO mice were stained for multiple markers. Percentage of B220+ cells in spleen (left panel); Absolute number of B220+ in spleen (right panel). Control mice, n = 15; CAT-KO mice, n = 8. B, Transitional and mature B cells. Left top panels, B220+ cells in spleen; Left middle panels, AA4.1+ and AA4.1− cells among B220+ cells; Left bottom panels, T1, T2, and T3 populations among AA4.1+B220+ cells defined by surface IgM and CD23. Histograms on the right show the percentage and number of the above populations in spleen. Control mice, n = 15; CAT-KO mice, n = 8. C, Follicular B cells. Left panels, Follicular B cells among AA4.1−B220+ population, defined as IgMlowCD23+ cells; Right panels, Percentage and number of follicular B cells in spleen. Control mice, n = 15; CAT-KO mice, n = 8. D, Marginal zone B cells. Left panels, Cytometric profiles of marginal zone cells defined as IgMhighIgDlowCD21high cells; Right panels, Percentage and number of marginal zone cells in spleen. Control mice, n = 15; CAT-KO mice, n = 8. *, Statistically significant difference (p < 0.05).

