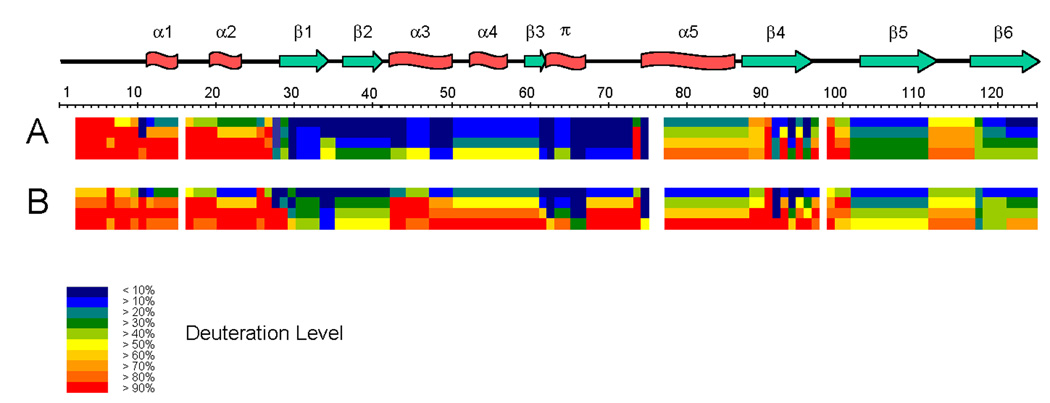
Fig. 3.
Amide H/D exchange for the PYP dark state (A) and the I2 intermediate (B). Each block represents protein sequence segments defined by overlapping peptides and consists of 4 time points (from top: 30 s, 300 s, 3000 s, 30000 s). The deuteration levels of each such segment at each time point are shown by different colors from blue (< 10% deuteration) through red (> 90% deuteration), as indicated in the figure. Residues 1–2, 16, 76–77, and 98 are not covered by any sequence segment. The secondary structure elements are shown on top of the protein sequence; α stands for α-helix, π for π-helix, β for β-sheet.

