


Fig. 2.
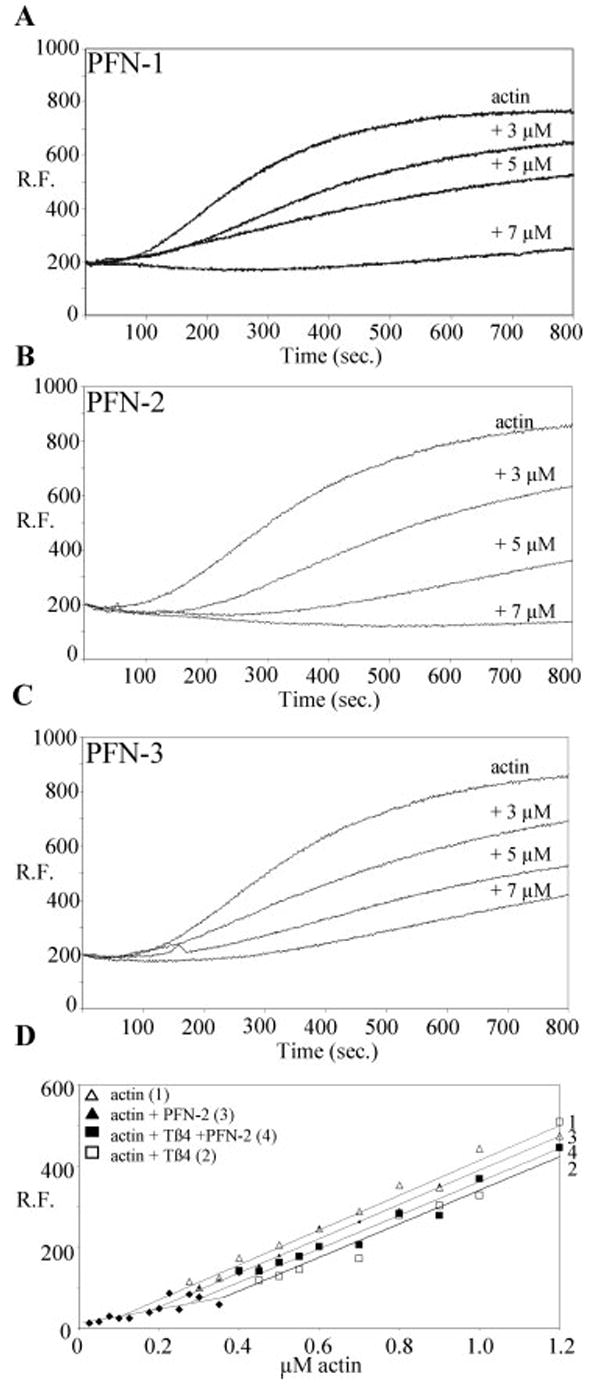
PFN-1, PFN-2, and PFN-3 have characteristic actin binding properties. (A–C) Time-course showing inhibition of actin polymerization activity of C. elegans profilins at the indicated profilin concentrations. The curve labeled actin is the control curve without profilin. The curves show the relative fluorescence (RF), proportional to the amount of F-actin formed, in function of time. (D) PFN-2 promotes actin assembly at uncapped barbed ends in the presence of thymosin β4. Different concentrations of actin filaments alone (curve 1) or incubated with thymosin β4 (5 μM) (curve 2), profilin (5 μM) (curve 3), or thymosin β4 and profilin (curve 4) were allowed to reach steady state before measurements. The symbols represent the actual data points.