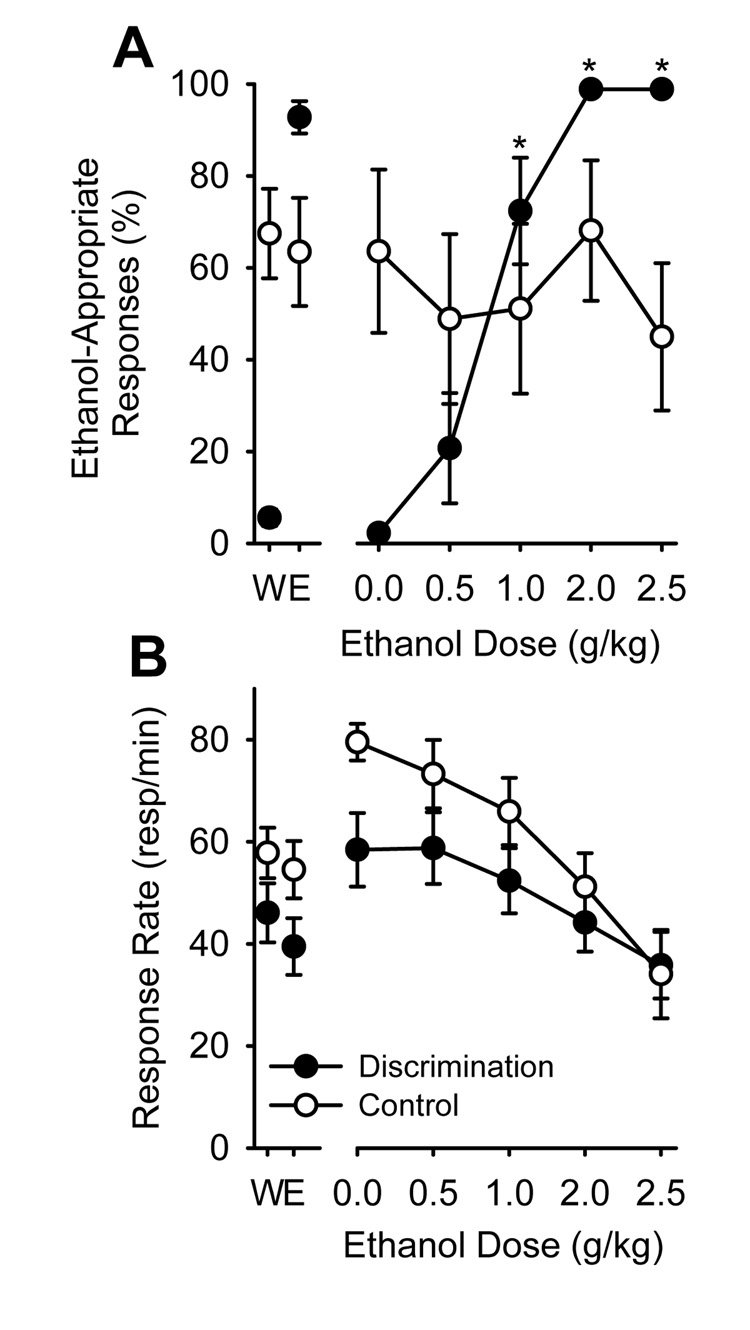
Figure 1.
Panel A. Mean (± SEM) percentage of ethanol-appropriate responding upon completion of the first FR10 at each ethanol dose tested in the discrimination-trained (Discrimination) and ethanol/behavior-matched control (Control). Panel B. Mean (± SEM) test session response rate at each ethanol dose tested. Data plotted on the left side of the x-axis break represent mean performance during the last 10 training days. * Indicates significant difference from 0 (water) in the discrimination-trained group (p<0.05).

