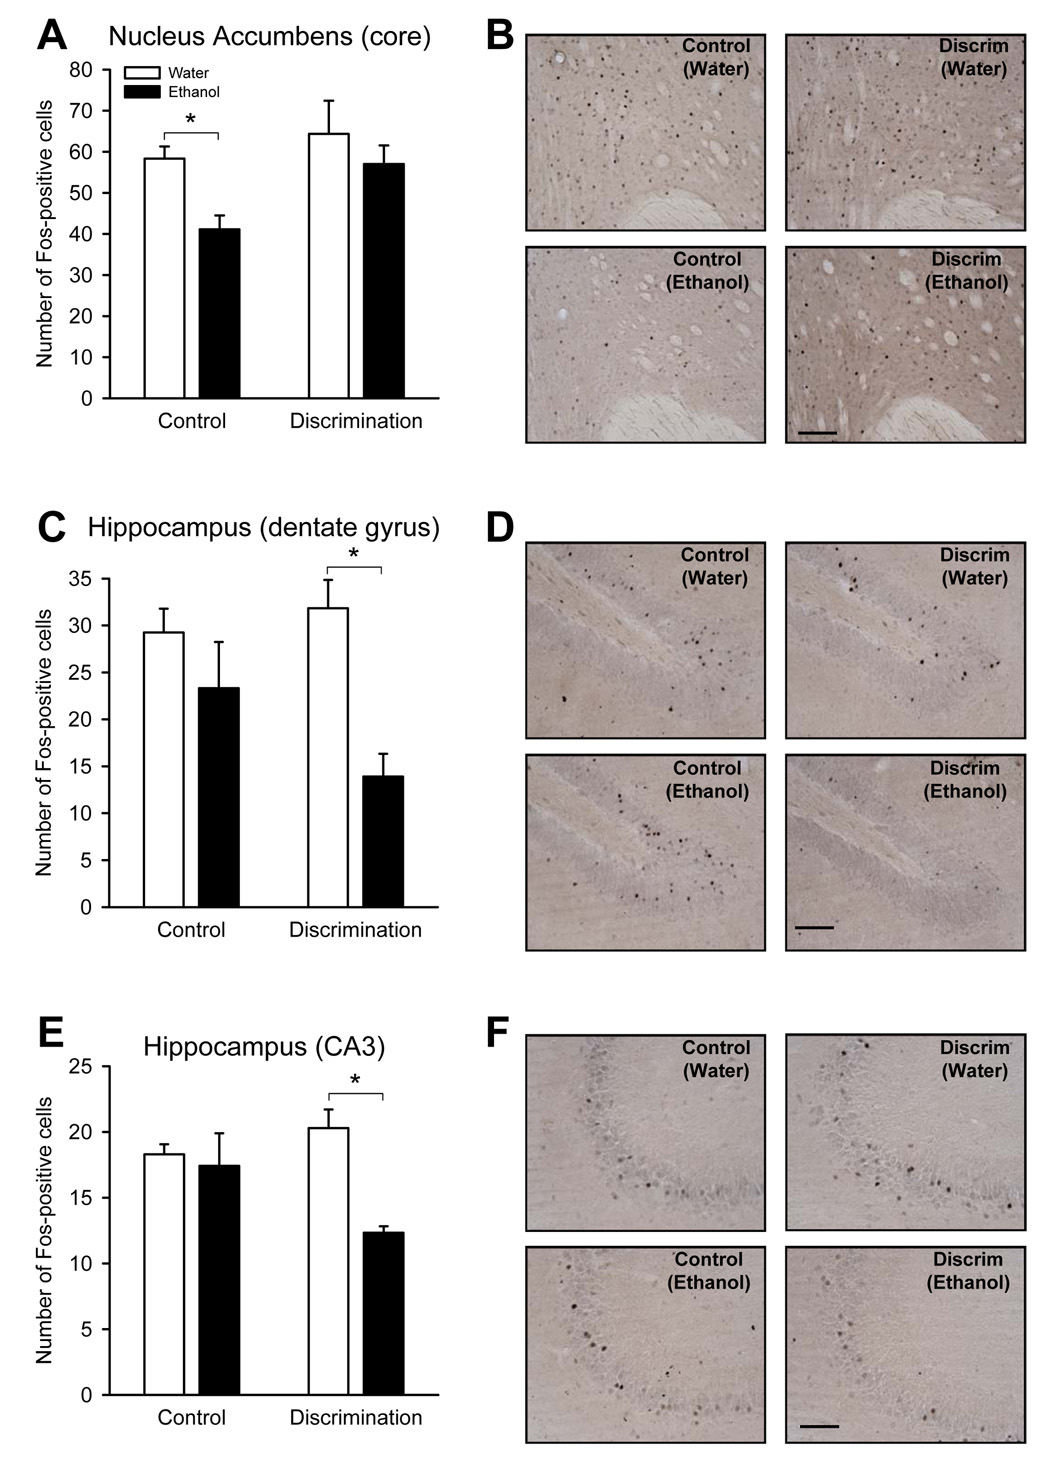
Figure 2.
Mean (± SEM) of Fos-positive cells in the ethanol/behavior-matched control group (Control) and the discrimination-trained group (Discrimination) after water (open bars) and 2 g/kg ethanol (filled bars) in the nucleus accumbens (core; Panel A), hippocampus (dentate gyrus; Panel C), and the hippocampus (CA3; Panel E), respectively. *p <0.05. Panels B, D, and F show representative photomicrographs (20X) of Fos-IR in the corresponding brain regions for each of the groups. Scale bar = 100 microns.

