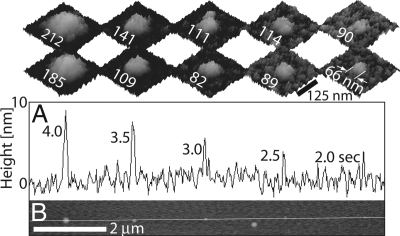
Fig. 4.
Effects of dwell time. (A) Height profile and (B) tapping mode AFM image of a row of 5 biotin-BSA dots deposited with decreasing dwell times (57% RH). The Insets above A are tapping-mode AFM images showing the diameter of the corresponding dots before (lower row) and after (upper row) immersion in streptavidin and then in biotin-IgG solutions (height scale is 15 nm).

